Pseudothermotoga lettingae (strain ATCC BAA-301 / DSM 14385 / NBRC 107922 / TMO) (Thermotoga lettingae)
Taxonomy: cellular organisms; Bacteria; Thermotogae; Thermotogae; Thermotogales; Thermotogaceae; Pseudothermotoga; Pseudothermotoga lettingae
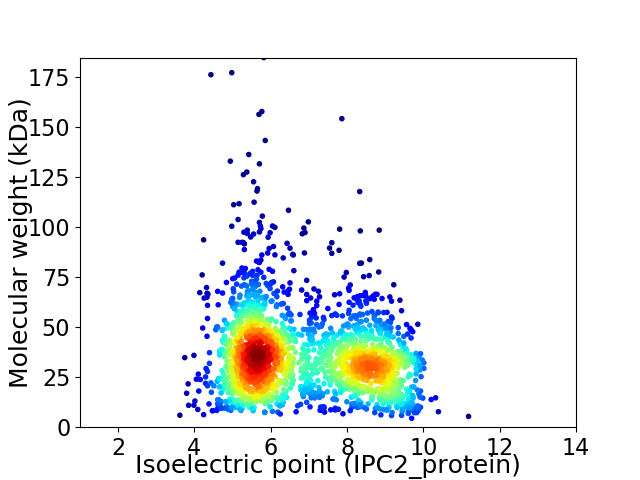
Average proteome isoelectric point is 6.82
Get precalculated fractions of proteins

Virtual 2D-PAGE plot for 2040 proteins (isoelectric point calculated using IPC2_protein)
Get csv file with sequences according to given criteria:
* You can choose from 21 different methods for calculating isoelectric point
Summary statistics related to proteome-wise predictions


Protein with the lowest isoelectric point:
>tr|A8F3V2|A8F3V2_PSELT Conserved carboxylase region OS=Pseudothermotoga lettingae (strain ATCC BAA-301 / DSM 14385 / NBRC 107922 / TMO) OX=416591 GN=Tlet_0266 PE=4 SV=1
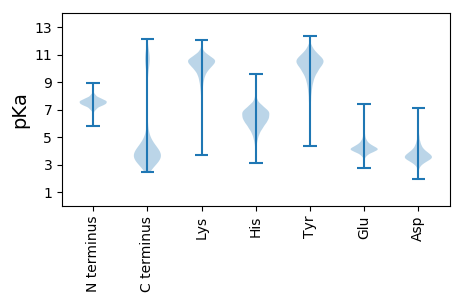
MM1 pKa = 7.47KK2 pKa = 10.41LKK4 pKa = 10.04TITTLWLIVASILLLSSCAFNLFGDD29 pKa = 4.9LEE31 pKa = 4.38FQSLLSSGTDD41 pKa = 3.35EE42 pKa = 5.15QKK44 pKa = 11.27LEE46 pKa = 4.01NAKK49 pKa = 10.36NALSSKK55 pKa = 10.59DD56 pKa = 3.51YY57 pKa = 10.11TKK59 pKa = 10.92AIALSGSVLNNILGLNLTNEE79 pKa = 4.35QLTSLLDD86 pKa = 3.73STSTLYY92 pKa = 10.78EE93 pKa = 4.3FAQSLYY99 pKa = 10.5EE100 pKa = 5.5KK101 pKa = 10.37KK102 pKa = 10.61DD103 pKa = 3.63EE104 pKa = 4.47LNEE107 pKa = 4.11TAVEE111 pKa = 3.9ALKK114 pKa = 11.18VLLEE118 pKa = 4.09ASASKK123 pKa = 10.65SEE125 pKa = 3.94KK126 pKa = 10.33SVNEE130 pKa = 4.2VIDD133 pKa = 4.26DD134 pKa = 3.93LSEE137 pKa = 3.96VAEE140 pKa = 3.89EE141 pKa = 4.2LGFNIGDD148 pKa = 3.99YY149 pKa = 10.49LPKK152 pKa = 10.59SMKK155 pKa = 10.23SSEE158 pKa = 4.22NLWEE162 pKa = 4.13ILEE165 pKa = 4.41SEE167 pKa = 4.34AGTIVSSVASFMDD180 pKa = 3.34NAEE183 pKa = 4.08LLKK186 pKa = 10.64FLTSGYY192 pKa = 9.55YY193 pKa = 10.86ALISTTDD200 pKa = 3.89DD201 pKa = 2.97ASMIYY206 pKa = 10.35AAFCAWYY213 pKa = 9.29DD214 pKa = 3.05ICYY217 pKa = 9.32MLNLVLDD224 pKa = 3.97IDD226 pKa = 4.17NDD228 pKa = 4.25GVITDD233 pKa = 3.97EE234 pKa = 5.15DD235 pKa = 4.19LVKK238 pKa = 10.37NTITSPASFTEE249 pKa = 4.49YY250 pKa = 11.06ASNTQSGLYY259 pKa = 9.72HH260 pKa = 7.39DD261 pKa = 5.49EE262 pKa = 4.22NSCDD266 pKa = 3.66EE267 pKa = 4.58FVWAYY272 pKa = 10.78DD273 pKa = 3.18ILTDD277 pKa = 4.75ILTTLDD283 pKa = 3.61IDD285 pKa = 4.34IDD287 pKa = 4.26LPDD290 pKa = 4.29APATQDD296 pKa = 4.48LYY298 pKa = 11.24DD299 pKa = 3.52AHH301 pKa = 6.7YY302 pKa = 10.94LPDD305 pKa = 4.09LFEE308 pKa = 5.02LLSGDD313 pKa = 4.2AEE315 pKa = 4.22
MM1 pKa = 7.47KK2 pKa = 10.41LKK4 pKa = 10.04TITTLWLIVASILLLSSCAFNLFGDD29 pKa = 4.9LEE31 pKa = 4.38FQSLLSSGTDD41 pKa = 3.35EE42 pKa = 5.15QKK44 pKa = 11.27LEE46 pKa = 4.01NAKK49 pKa = 10.36NALSSKK55 pKa = 10.59DD56 pKa = 3.51YY57 pKa = 10.11TKK59 pKa = 10.92AIALSGSVLNNILGLNLTNEE79 pKa = 4.35QLTSLLDD86 pKa = 3.73STSTLYY92 pKa = 10.78EE93 pKa = 4.3FAQSLYY99 pKa = 10.5EE100 pKa = 5.5KK101 pKa = 10.37KK102 pKa = 10.61DD103 pKa = 3.63EE104 pKa = 4.47LNEE107 pKa = 4.11TAVEE111 pKa = 3.9ALKK114 pKa = 11.18VLLEE118 pKa = 4.09ASASKK123 pKa = 10.65SEE125 pKa = 3.94KK126 pKa = 10.33SVNEE130 pKa = 4.2VIDD133 pKa = 4.26DD134 pKa = 3.93LSEE137 pKa = 3.96VAEE140 pKa = 3.89EE141 pKa = 4.2LGFNIGDD148 pKa = 3.99YY149 pKa = 10.49LPKK152 pKa = 10.59SMKK155 pKa = 10.23SSEE158 pKa = 4.22NLWEE162 pKa = 4.13ILEE165 pKa = 4.41SEE167 pKa = 4.34AGTIVSSVASFMDD180 pKa = 3.34NAEE183 pKa = 4.08LLKK186 pKa = 10.64FLTSGYY192 pKa = 9.55YY193 pKa = 10.86ALISTTDD200 pKa = 3.89DD201 pKa = 2.97ASMIYY206 pKa = 10.35AAFCAWYY213 pKa = 9.29DD214 pKa = 3.05ICYY217 pKa = 9.32MLNLVLDD224 pKa = 3.97IDD226 pKa = 4.17NDD228 pKa = 4.25GVITDD233 pKa = 3.97EE234 pKa = 5.15DD235 pKa = 4.19LVKK238 pKa = 10.37NTITSPASFTEE249 pKa = 4.49YY250 pKa = 11.06ASNTQSGLYY259 pKa = 9.72HH260 pKa = 7.39DD261 pKa = 5.49EE262 pKa = 4.22NSCDD266 pKa = 3.66EE267 pKa = 4.58FVWAYY272 pKa = 10.78DD273 pKa = 3.18ILTDD277 pKa = 4.75ILTTLDD283 pKa = 3.61IDD285 pKa = 4.34IDD287 pKa = 4.26LPDD290 pKa = 4.29APATQDD296 pKa = 4.48LYY298 pKa = 11.24DD299 pKa = 3.52AHH301 pKa = 6.7YY302 pKa = 10.94LPDD305 pKa = 4.09LFEE308 pKa = 5.02LLSGDD313 pKa = 4.2AEE315 pKa = 4.22
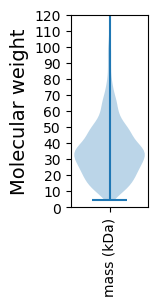
Molecular weight: 34.72 kDa
Isoelectric point according different methods:
Protein with the highest isoelectric point:
>tr|A8F5D6|A8F5D6_PSELT DegV family protein OS=Pseudothermotoga lettingae (strain ATCC BAA-301 / DSM 14385 / NBRC 107922 / TMO) OX=416591 GN=Tlet_0804 PE=4 SV=1
MM1 pKa = 7.35KK2 pKa = 9.4RR3 pKa = 11.84TYY5 pKa = 10.21QPNRR9 pKa = 11.84RR10 pKa = 11.84KK11 pKa = 10.07RR12 pKa = 11.84KK13 pKa = 7.27RR14 pKa = 11.84THH16 pKa = 5.79GFLVRR21 pKa = 11.84SRR23 pKa = 11.84TPSGRR28 pKa = 11.84RR29 pKa = 11.84VLARR33 pKa = 11.84RR34 pKa = 11.84RR35 pKa = 11.84AKK37 pKa = 10.45GRR39 pKa = 11.84WKK41 pKa = 10.38IAVV44 pKa = 3.39
MM1 pKa = 7.35KK2 pKa = 9.4RR3 pKa = 11.84TYY5 pKa = 10.21QPNRR9 pKa = 11.84RR10 pKa = 11.84KK11 pKa = 10.07RR12 pKa = 11.84KK13 pKa = 7.27RR14 pKa = 11.84THH16 pKa = 5.79GFLVRR21 pKa = 11.84SRR23 pKa = 11.84TPSGRR28 pKa = 11.84RR29 pKa = 11.84VLARR33 pKa = 11.84RR34 pKa = 11.84RR35 pKa = 11.84AKK37 pKa = 10.45GRR39 pKa = 11.84WKK41 pKa = 10.38IAVV44 pKa = 3.39
Molecular weight: 5.39 kDa
Isoelectric point according different methods:
Peptides (in silico digests for buttom-up proteomics)
Below you can find in silico digests of the whole proteome with Trypsin, Chymotrypsin, Trypsin+LysC, LysN, ArgC proteases suitable for different mass spec machines.| Try ESI |
 |
|---|
| ChTry ESI |
 |
|---|
| ArgC ESI |
 |
|---|
| LysN ESI |
 |
|---|
| TryLysC ESI |
 |
|---|
| Try MALDI |
 |
|---|
| ChTry MALDI |
 |
|---|
| ArgC MALDI |
 |
|---|
| LysN MALDI |
 |
|---|
| TryLysC MALDI |
 |
|---|
| Try LTQ |
 |
|---|
| ChTry LTQ |
 |
|---|
| ArgC LTQ |
 |
|---|
| LysN LTQ |
 |
|---|
| TryLysC LTQ |
 |
|---|
| Try MSlow |
 |
|---|
| ChTry MSlow |
 |
|---|
| ArgC MSlow |
 |
|---|
| LysN MSlow |
 |
|---|
| TryLysC MSlow |
 |
|---|
| Try MShigh |
 |
|---|
| ChTry MShigh |
 |
|---|
| ArgC MShigh |
 |
|---|
| LysN MShigh |
 |
|---|
| TryLysC MShigh |
 |
|---|
General Statistics
Number of major isoforms |
Number of additional isoforms |
Number of all proteins |
Number of amino acids |
Min. Seq. Length |
Max. Seq. Length |
Avg. Seq. Length |
Avg. Mol. Weight |
|---|---|---|---|---|---|---|---|
0 |
668507 |
38 |
1650 |
327.7 |
36.97 |
Amino acid frequency
Ala |
Cys |
Asp |
Glu |
Phe |
Gly |
His |
Ile |
Lys |
Leu |
|---|---|---|---|---|---|---|---|---|---|
6.405 ± 0.047 | 0.95 ± 0.016 |
4.996 ± 0.039 | 7.019 ± 0.057 |
5.187 ± 0.04 | 6.479 ± 0.042 |
1.596 ± 0.021 | 8.644 ± 0.041 |
7.487 ± 0.041 | 9.938 ± 0.046 |
Met |
Asn |
Gln |
Pro |
Arg |
Ser |
Thr |
Val |
Trp |
Tyr |
|---|---|---|---|---|---|---|---|---|---|
2.541 ± 0.022 | 4.301 ± 0.031 |
3.67 ± 0.03 | 2.861 ± 0.032 |
4.503 ± 0.041 | 6.489 ± 0.042 |
4.725 ± 0.031 | 7.529 ± 0.037 |
1.013 ± 0.02 | 3.668 ± 0.033 |
Most of the basic statistics you can see at this page can be downloaded from this CSV file
Proteome-pI is available under Creative Commons Attribution-NoDerivs license, for more details see here
| Reference: Kozlowski LP. Proteome-pI 2.0: Proteome Isoelectric Point Database Update. Nucleic Acids Res. 2021, doi: 10.1093/nar/gkab944 | Contact: Lukasz P. Kozlowski |
