Lachnospiraceae bacterium G41
Taxonomy: cellular organisms; Bacteria; Terrabacteria group; Firmicutes; Clostridia; Eubacteriales; Lachnospiraceae; unclassified Lachnospiraceae
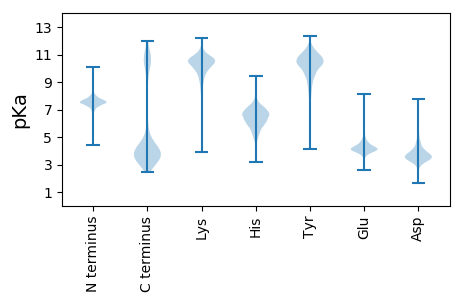
Average proteome isoelectric point is 5.81
Get precalculated fractions of proteins

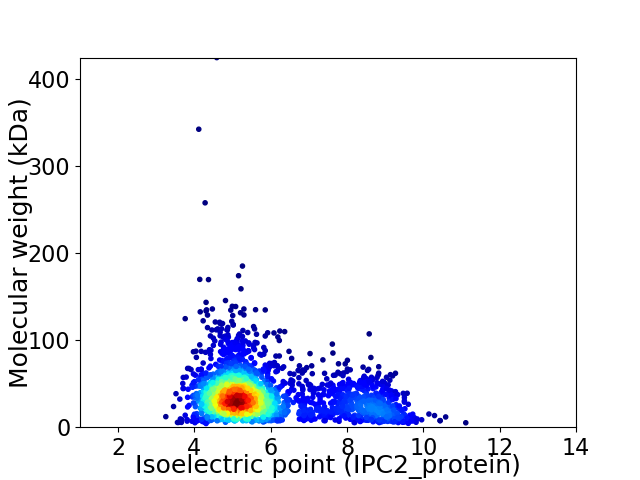
Virtual 2D-PAGE plot for 2367 proteins (isoelectric point calculated using IPC2_protein)
Get csv file with sequences according to given criteria:
* You can choose from 21 different methods for calculating isoelectric point
Summary statistics related to proteome-wise predictions


Protein with the lowest isoelectric point:
>tr|A0A1G8RD74|A0A1G8RD74_9FIRM Alpha-glucosidase OS=Lachnospiraceae bacterium G41 OX=1200749 GN=SAMN04487760_10339 PE=4 SV=1
MM1 pKa = 7.26EE2 pKa = 5.76RR3 pKa = 11.84KK4 pKa = 9.48DD5 pKa = 4.07ANFFSAQIRR14 pKa = 11.84LWAGIFDD21 pKa = 3.91YY22 pKa = 10.67KK23 pKa = 10.91GRR25 pKa = 11.84STRR28 pKa = 11.84KK29 pKa = 8.47EE30 pKa = 3.37YY31 pKa = 9.91WFAFLFHH38 pKa = 6.96FGLGVLAFFGMLISSAIFLLQDD60 pKa = 3.65FVDD63 pKa = 5.37ASILLNIVHH72 pKa = 7.51FILLIPAVLILIYY85 pKa = 10.27LGLSIIPWIALTVRR99 pKa = 11.84RR100 pKa = 11.84LRR102 pKa = 11.84DD103 pKa = 3.36AGKK106 pKa = 10.36SGWWTILLLFVGIGHH121 pKa = 7.71IILLILCALGSAVVGVAFFAANNIQPSVYY150 pKa = 10.27GPPEE154 pKa = 3.84WFDD157 pKa = 3.63PDD159 pKa = 4.18VNINDD164 pKa = 4.11GVYY167 pKa = 10.5GPPGPDD173 pKa = 3.12IFNPDD178 pKa = 3.83DD179 pKa = 3.94NEE181 pKa = 4.3TPTVYY186 pKa = 10.54GPPEE190 pKa = 4.25WFDD193 pKa = 4.95DD194 pKa = 5.13DD195 pKa = 6.26DD196 pKa = 6.67DD197 pKa = 5.29FDD199 pKa = 5.24PSINDD204 pKa = 3.43SEE206 pKa = 4.44PLYY209 pKa = 10.76GPPPFDD215 pKa = 4.63EE216 pKa = 6.15DD217 pKa = 5.8DD218 pKa = 3.71YY219 pKa = 11.98DD220 pKa = 4.46PNINQNEE227 pKa = 4.28DD228 pKa = 3.72VYY230 pKa = 11.5GPPEE234 pKa = 4.14WLNDD238 pKa = 3.52PDD240 pKa = 4.59EE241 pKa = 4.81YY242 pKa = 11.49DD243 pKa = 3.61PEE245 pKa = 4.48VNLNEE250 pKa = 4.49DD251 pKa = 3.89VYY253 pKa = 11.42GPPEE257 pKa = 3.65WFEE260 pKa = 4.17EE261 pKa = 4.22NEE263 pKa = 3.77NDD265 pKa = 4.87FDD267 pKa = 4.39VDD269 pKa = 4.41LNMEE273 pKa = 4.2PTVYY277 pKa = 10.56GPPDD281 pKa = 3.1WFEE284 pKa = 3.71
MM1 pKa = 7.26EE2 pKa = 5.76RR3 pKa = 11.84KK4 pKa = 9.48DD5 pKa = 4.07ANFFSAQIRR14 pKa = 11.84LWAGIFDD21 pKa = 3.91YY22 pKa = 10.67KK23 pKa = 10.91GRR25 pKa = 11.84STRR28 pKa = 11.84KK29 pKa = 8.47EE30 pKa = 3.37YY31 pKa = 9.91WFAFLFHH38 pKa = 6.96FGLGVLAFFGMLISSAIFLLQDD60 pKa = 3.65FVDD63 pKa = 5.37ASILLNIVHH72 pKa = 7.51FILLIPAVLILIYY85 pKa = 10.27LGLSIIPWIALTVRR99 pKa = 11.84RR100 pKa = 11.84LRR102 pKa = 11.84DD103 pKa = 3.36AGKK106 pKa = 10.36SGWWTILLLFVGIGHH121 pKa = 7.71IILLILCALGSAVVGVAFFAANNIQPSVYY150 pKa = 10.27GPPEE154 pKa = 3.84WFDD157 pKa = 3.63PDD159 pKa = 4.18VNINDD164 pKa = 4.11GVYY167 pKa = 10.5GPPGPDD173 pKa = 3.12IFNPDD178 pKa = 3.83DD179 pKa = 3.94NEE181 pKa = 4.3TPTVYY186 pKa = 10.54GPPEE190 pKa = 4.25WFDD193 pKa = 4.95DD194 pKa = 5.13DD195 pKa = 6.26DD196 pKa = 6.67DD197 pKa = 5.29FDD199 pKa = 5.24PSINDD204 pKa = 3.43SEE206 pKa = 4.44PLYY209 pKa = 10.76GPPPFDD215 pKa = 4.63EE216 pKa = 6.15DD217 pKa = 5.8DD218 pKa = 3.71YY219 pKa = 11.98DD220 pKa = 4.46PNINQNEE227 pKa = 4.28DD228 pKa = 3.72VYY230 pKa = 11.5GPPEE234 pKa = 4.14WLNDD238 pKa = 3.52PDD240 pKa = 4.59EE241 pKa = 4.81YY242 pKa = 11.49DD243 pKa = 3.61PEE245 pKa = 4.48VNLNEE250 pKa = 4.49DD251 pKa = 3.89VYY253 pKa = 11.42GPPEE257 pKa = 3.65WFEE260 pKa = 4.17EE261 pKa = 4.22NEE263 pKa = 3.77NDD265 pKa = 4.87FDD267 pKa = 4.39VDD269 pKa = 4.41LNMEE273 pKa = 4.2PTVYY277 pKa = 10.56GPPDD281 pKa = 3.1WFEE284 pKa = 3.71
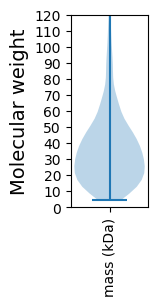
Molecular weight: 32.3 kDa
Isoelectric point according different methods:
Protein with the highest isoelectric point:
>tr|A0A1G8U294|A0A1G8U294_9FIRM tRNA (guanine-N(7)-)-methyltransferase OS=Lachnospiraceae bacterium G41 OX=1200749 GN=trmB PE=3 SV=1
MM1 pKa = 7.67KK2 pKa = 8.72MTFQPKK8 pKa = 8.93KK9 pKa = 7.56RR10 pKa = 11.84QRR12 pKa = 11.84NKK14 pKa = 8.21VHH16 pKa = 6.58GFRR19 pKa = 11.84ARR21 pKa = 11.84MSTPGGRR28 pKa = 11.84KK29 pKa = 8.72VLQARR34 pKa = 11.84RR35 pKa = 11.84AKK37 pKa = 9.62GRR39 pKa = 11.84KK40 pKa = 8.73VLSAA44 pKa = 4.05
MM1 pKa = 7.67KK2 pKa = 8.72MTFQPKK8 pKa = 8.93KK9 pKa = 7.56RR10 pKa = 11.84QRR12 pKa = 11.84NKK14 pKa = 8.21VHH16 pKa = 6.58GFRR19 pKa = 11.84ARR21 pKa = 11.84MSTPGGRR28 pKa = 11.84KK29 pKa = 8.72VLQARR34 pKa = 11.84RR35 pKa = 11.84AKK37 pKa = 9.62GRR39 pKa = 11.84KK40 pKa = 8.73VLSAA44 pKa = 4.05
Molecular weight: 5.1 kDa
Isoelectric point according different methods:
Peptides (in silico digests for buttom-up proteomics)
Below you can find in silico digests of the whole proteome with Trypsin, Chymotrypsin, Trypsin+LysC, LysN, ArgC proteases suitable for different mass spec machines.| Try ESI |
 |
|---|
| ChTry ESI |
 |
|---|
| ArgC ESI |
 |
|---|
| LysN ESI |
 |
|---|
| TryLysC ESI |
 |
|---|
| Try MALDI |
 |
|---|
| ChTry MALDI |
 |
|---|
| ArgC MALDI |
 |
|---|
| LysN MALDI |
 |
|---|
| TryLysC MALDI |
 |
|---|
| Try LTQ |
 |
|---|
| ChTry LTQ |
 |
|---|
| ArgC LTQ |
 |
|---|
| LysN LTQ |
 |
|---|
| TryLysC LTQ |
 |
|---|
| Try MSlow |
 |
|---|
| ChTry MSlow |
 |
|---|
| ArgC MSlow |
 |
|---|
| LysN MSlow |
 |
|---|
| TryLysC MSlow |
 |
|---|
| Try MShigh |
 |
|---|
| ChTry MShigh |
 |
|---|
| ArgC MShigh |
 |
|---|
| LysN MShigh |
 |
|---|
| TryLysC MShigh |
 |
|---|
General Statistics
Number of major isoforms |
Number of additional isoforms |
Number of all proteins |
Number of amino acids |
Min. Seq. Length |
Max. Seq. Length |
Avg. Seq. Length |
Avg. Mol. Weight |
|---|---|---|---|---|---|---|---|
0 |
793647 |
39 |
3850 |
335.3 |
37.77 |
Amino acid frequency
Ala |
Cys |
Asp |
Glu |
Phe |
Gly |
His |
Ile |
Lys |
Leu |
|---|---|---|---|---|---|---|---|---|---|
6.754 ± 0.05 | 1.439 ± 0.022 |
6.338 ± 0.047 | 7.93 ± 0.064 |
4.713 ± 0.045 | 6.677 ± 0.043 |
1.461 ± 0.018 | 8.224 ± 0.053 |
7.91 ± 0.049 | 8.502 ± 0.052 |
Met |
Asn |
Gln |
Pro |
Arg |
Ser |
Thr |
Val |
Trp |
Tyr |
|---|---|---|---|---|---|---|---|---|---|
2.766 ± 0.026 | 5.177 ± 0.044 |
3.118 ± 0.028 | 2.126 ± 0.026 |
3.554 ± 0.034 | 5.947 ± 0.044 |
5.205 ± 0.051 | 6.812 ± 0.038 |
0.831 ± 0.018 | 4.517 ± 0.044 |
Most of the basic statistics you can see at this page can be downloaded from this CSV file
Proteome-pI is available under Creative Commons Attribution-NoDerivs license, for more details see here
| Reference: Kozlowski LP. Proteome-pI 2.0: Proteome Isoelectric Point Database Update. Nucleic Acids Res. 2021, doi: 10.1093/nar/gkab944 | Contact: Lukasz P. Kozlowski |
