Klebsiella phage vB_KpnM_KpV52
Taxonomy: Viruses; Duplodnaviria; Heunggongvirae; Uroviricota; Caudoviricetes; Caudovirales; Myoviridae; Jedunavirus; Klebsiella virus KpV80
Average proteome isoelectric point is 6.42
Get precalculated fractions of proteins

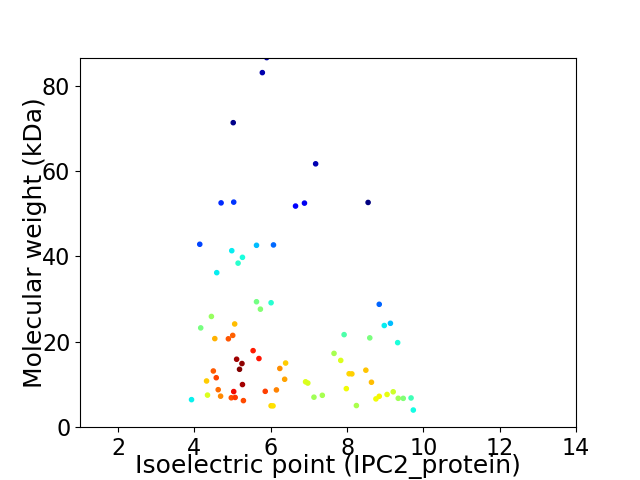
Virtual 2D-PAGE plot for 75 proteins (isoelectric point calculated using IPC2_protein)
Get csv file with sequences according to given criteria:
* You can choose from 21 different methods for calculating isoelectric point
Summary statistics related to proteome-wise predictions


Protein with the lowest isoelectric point:
>tr|A0A1I9SEV9|A0A1I9SEV9_9CAUD Putative tail fiber family protein OS=Klebsiella phage vB_KpnM_KpV52 OX=1912321 GN=kpv52_42 PE=4 SV=1
MM1 pKa = 7.92AEE3 pKa = 4.19LTSTGYY9 pKa = 9.8SVKK12 pKa = 10.61SQNDD16 pKa = 3.0WFDD19 pKa = 3.59EE20 pKa = 4.25EE21 pKa = 4.28KK22 pKa = 10.67QLYY25 pKa = 10.35LDD27 pKa = 5.34IDD29 pKa = 4.75SNWNLDD35 pKa = 3.15PSTPDD40 pKa = 3.47GLKK43 pKa = 9.09MAHH46 pKa = 6.79DD47 pKa = 4.33AEE49 pKa = 4.65IFSALDD55 pKa = 3.24EE56 pKa = 4.48VLQQAYY62 pKa = 10.17NSKK65 pKa = 10.83DD66 pKa = 3.36PNKK69 pKa = 10.71ASGYY73 pKa = 10.2DD74 pKa = 3.51LDD76 pKa = 4.94VICALTGTVRR86 pKa = 11.84SEE88 pKa = 4.03GTASTVTGFVLTGVAGTQVPAGTRR112 pKa = 11.84FEE114 pKa = 4.52SSVTGYY120 pKa = 10.93RR121 pKa = 11.84FTLDD125 pKa = 3.18QTWTLDD131 pKa = 3.37SSGTATVDD139 pKa = 3.23ITCTTVGEE147 pKa = 4.34IEE149 pKa = 4.58ADD151 pKa = 3.23ANTITTIVDD160 pKa = 3.73TVAGLVSVNNPTPATPGTSAEE181 pKa = 4.23SDD183 pKa = 3.05GSLRR187 pKa = 11.84LKK189 pKa = 10.49RR190 pKa = 11.84ATAVGLPGSNQVDD203 pKa = 3.73SMLGQLFNVDD213 pKa = 2.55GVRR216 pKa = 11.84RR217 pKa = 11.84VRR219 pKa = 11.84VYY221 pKa = 11.09EE222 pKa = 4.02NDD224 pKa = 3.25EE225 pKa = 4.03ATTDD229 pKa = 3.55SNGQPGHH236 pKa = 6.53SIAPIVDD243 pKa = 3.4GGTDD247 pKa = 4.0DD248 pKa = 4.34DD249 pKa = 4.11VAMAIYY255 pKa = 10.12LKK257 pKa = 10.4KK258 pKa = 10.36NPGVAFYY265 pKa = 10.53QAGTGVTVTVTSPTYY280 pKa = 8.95PTMTKK285 pKa = 9.97DD286 pKa = 3.14IKK288 pKa = 10.47FSRR291 pKa = 11.84PVYY294 pKa = 9.2VDD296 pKa = 2.87MVVVIEE302 pKa = 4.51IKK304 pKa = 10.65DD305 pKa = 3.9DD306 pKa = 3.66GTLPSQAILEE316 pKa = 4.09PLIRR320 pKa = 11.84DD321 pKa = 4.37AIMEE325 pKa = 4.23YY326 pKa = 10.67AAGGLIPTEE335 pKa = 4.23YY336 pKa = 10.73GFKK339 pKa = 10.12PDD341 pKa = 3.92GFDD344 pKa = 2.96IGEE347 pKa = 4.3TVPYY351 pKa = 10.09SSLYY355 pKa = 9.26TPINKK360 pKa = 9.51VIGSYY365 pKa = 10.9GNSYY369 pKa = 9.48VNSMTLNGGTANVTIKK385 pKa = 10.62FNEE388 pKa = 3.93LSRR391 pKa = 11.84WTTSNITVTIVV402 pKa = 2.6
MM1 pKa = 7.92AEE3 pKa = 4.19LTSTGYY9 pKa = 9.8SVKK12 pKa = 10.61SQNDD16 pKa = 3.0WFDD19 pKa = 3.59EE20 pKa = 4.25EE21 pKa = 4.28KK22 pKa = 10.67QLYY25 pKa = 10.35LDD27 pKa = 5.34IDD29 pKa = 4.75SNWNLDD35 pKa = 3.15PSTPDD40 pKa = 3.47GLKK43 pKa = 9.09MAHH46 pKa = 6.79DD47 pKa = 4.33AEE49 pKa = 4.65IFSALDD55 pKa = 3.24EE56 pKa = 4.48VLQQAYY62 pKa = 10.17NSKK65 pKa = 10.83DD66 pKa = 3.36PNKK69 pKa = 10.71ASGYY73 pKa = 10.2DD74 pKa = 3.51LDD76 pKa = 4.94VICALTGTVRR86 pKa = 11.84SEE88 pKa = 4.03GTASTVTGFVLTGVAGTQVPAGTRR112 pKa = 11.84FEE114 pKa = 4.52SSVTGYY120 pKa = 10.93RR121 pKa = 11.84FTLDD125 pKa = 3.18QTWTLDD131 pKa = 3.37SSGTATVDD139 pKa = 3.23ITCTTVGEE147 pKa = 4.34IEE149 pKa = 4.58ADD151 pKa = 3.23ANTITTIVDD160 pKa = 3.73TVAGLVSVNNPTPATPGTSAEE181 pKa = 4.23SDD183 pKa = 3.05GSLRR187 pKa = 11.84LKK189 pKa = 10.49RR190 pKa = 11.84ATAVGLPGSNQVDD203 pKa = 3.73SMLGQLFNVDD213 pKa = 2.55GVRR216 pKa = 11.84RR217 pKa = 11.84VRR219 pKa = 11.84VYY221 pKa = 11.09EE222 pKa = 4.02NDD224 pKa = 3.25EE225 pKa = 4.03ATTDD229 pKa = 3.55SNGQPGHH236 pKa = 6.53SIAPIVDD243 pKa = 3.4GGTDD247 pKa = 4.0DD248 pKa = 4.34DD249 pKa = 4.11VAMAIYY255 pKa = 10.12LKK257 pKa = 10.4KK258 pKa = 10.36NPGVAFYY265 pKa = 10.53QAGTGVTVTVTSPTYY280 pKa = 8.95PTMTKK285 pKa = 9.97DD286 pKa = 3.14IKK288 pKa = 10.47FSRR291 pKa = 11.84PVYY294 pKa = 9.2VDD296 pKa = 2.87MVVVIEE302 pKa = 4.51IKK304 pKa = 10.65DD305 pKa = 3.9DD306 pKa = 3.66GTLPSQAILEE316 pKa = 4.09PLIRR320 pKa = 11.84DD321 pKa = 4.37AIMEE325 pKa = 4.23YY326 pKa = 10.67AAGGLIPTEE335 pKa = 4.23YY336 pKa = 10.73GFKK339 pKa = 10.12PDD341 pKa = 3.92GFDD344 pKa = 2.96IGEE347 pKa = 4.3TVPYY351 pKa = 10.09SSLYY355 pKa = 9.26TPINKK360 pKa = 9.51VIGSYY365 pKa = 10.9GNSYY369 pKa = 9.48VNSMTLNGGTANVTIKK385 pKa = 10.62FNEE388 pKa = 3.93LSRR391 pKa = 11.84WTTSNITVTIVV402 pKa = 2.6
Molecular weight: 42.84 kDa
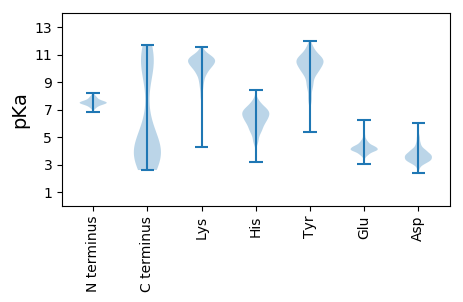
Isoelectric point according different methods:
Protein with the highest isoelectric point:
>tr|A0A1I9SEW7|A0A1I9SEW7_9CAUD Uncharacterized protein OS=Klebsiella phage vB_KpnM_KpV52 OX=1912321 GN=kpv52_50 PE=4 SV=1
MM1 pKa = 7.47YY2 pKa = 7.54EE3 pKa = 4.07TKK5 pKa = 10.49SAAVKK10 pKa = 9.52PRR12 pKa = 11.84KK13 pKa = 10.14AGDD16 pKa = 3.21AGGACVKK23 pKa = 10.29PRR25 pKa = 11.84GKK27 pKa = 9.04TGDD30 pKa = 3.42AKK32 pKa = 10.82VKK34 pKa = 10.44RR35 pKa = 11.84RR36 pKa = 11.84TKK38 pKa = 10.68
MM1 pKa = 7.47YY2 pKa = 7.54EE3 pKa = 4.07TKK5 pKa = 10.49SAAVKK10 pKa = 9.52PRR12 pKa = 11.84KK13 pKa = 10.14AGDD16 pKa = 3.21AGGACVKK23 pKa = 10.29PRR25 pKa = 11.84GKK27 pKa = 9.04TGDD30 pKa = 3.42AKK32 pKa = 10.82VKK34 pKa = 10.44RR35 pKa = 11.84RR36 pKa = 11.84TKK38 pKa = 10.68
Molecular weight: 4.02 kDa
Isoelectric point according different methods:
Peptides (in silico digests for buttom-up proteomics)
Below you can find in silico digests of the whole proteome with Trypsin, Chymotrypsin, Trypsin+LysC, LysN, ArgC proteases suitable for different mass spec machines.| Try ESI |
 |
|---|
| ChTry ESI |
 |
|---|
| ArgC ESI |
 |
|---|
| LysN ESI |
 |
|---|
| TryLysC ESI |
 |
|---|
| Try MALDI |
 |
|---|
| ChTry MALDI |
 |
|---|
| ArgC MALDI |
 |
|---|
| LysN MALDI |
 |
|---|
| TryLysC MALDI |
 |
|---|
| Try LTQ |
 |
|---|
| ChTry LTQ |
 |
|---|
| ArgC LTQ |
 |
|---|
| LysN LTQ |
 |
|---|
| TryLysC LTQ |
 |
|---|
| Try MSlow |
 |
|---|
| ChTry MSlow |
 |
|---|
| ArgC MSlow |
 |
|---|
| LysN MSlow |
 |
|---|
| TryLysC MSlow |
 |
|---|
| Try MShigh |
 |
|---|
| ChTry MShigh |
 |
|---|
| ArgC MShigh |
 |
|---|
| LysN MShigh |
 |
|---|
| TryLysC MShigh |
 |
|---|
General Statistics
Number of major isoforms |
Number of additional isoforms |
Number of all proteins |
Number of amino acids |
Min. Seq. Length |
Max. Seq. Length |
Avg. Seq. Length |
Avg. Mol. Weight |
|---|---|---|---|---|---|---|---|
0 |
14817 |
38 |
785 |
197.6 |
21.94 |
Amino acid frequency
Ala |
Cys |
Asp |
Glu |
Phe |
Gly |
His |
Ile |
Lys |
Leu |
|---|---|---|---|---|---|---|---|---|---|
8.517 ± 0.407 | 1.485 ± 0.17 |
6.155 ± 0.198 | 5.77 ± 0.349 |
3.348 ± 0.213 | 7.525 ± 0.285 |
1.937 ± 0.185 | 5.777 ± 0.196 |
5.548 ± 0.282 | 7.296 ± 0.191 |
Met |
Asn |
Gln |
Pro |
Arg |
Ser |
Thr |
Val |
Trp |
Tyr |
|---|---|---|---|---|---|---|---|---|---|
2.808 ± 0.158 | 4.988 ± 0.268 |
4.022 ± 0.211 | 3.921 ± 0.238 |
5.46 ± 0.238 | 6.061 ± 0.292 |
6.837 ± 0.285 | 7.458 ± 0.245 |
1.539 ± 0.095 | 3.55 ± 0.161 |
Most of the basic statistics you can see at this page can be downloaded from this CSV file
Proteome-pI is available under Creative Commons Attribution-NoDerivs license, for more details see here
| Reference: Kozlowski LP. Proteome-pI 2.0: Proteome Isoelectric Point Database Update. Nucleic Acids Res. 2021, doi: 10.1093/nar/gkab944 | Contact: Lukasz P. Kozlowski |
