Streptococcus virus MS1
Taxonomy: Viruses; Duplodnaviria; Heunggongvirae; Uroviricota; Caudoviricetes; Caudovirales; Siphoviridae; unclassified Siphoviridae
Average proteome isoelectric point is 6.26
Get precalculated fractions of proteins

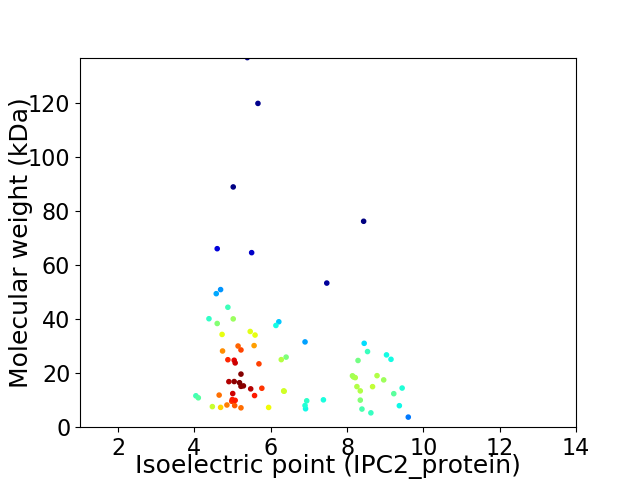
Virtual 2D-PAGE plot for 77 proteins (isoelectric point calculated using IPC2_protein)
Get csv file with sequences according to given criteria:
* You can choose from 21 different methods for calculating isoelectric point
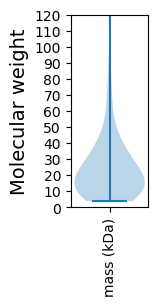
Summary statistics related to proteome-wise predictions


Protein with the lowest isoelectric point:
>tr|A0A1U9WR88|A0A1U9WR88_9CAUD Uncharacterized protein OS=Streptococcus virus MS1 OX=1962672 GN=MS1_33 PE=4 SV=1
MM1 pKa = 7.39EE2 pKa = 5.86RR3 pKa = 11.84IKK5 pKa = 10.12TLFHH9 pKa = 6.5VIYY12 pKa = 11.06NNGTHH17 pKa = 6.78LEE19 pKa = 4.13VAALFDD25 pKa = 4.58TIDD28 pKa = 4.54DD29 pKa = 3.67YY30 pKa = 12.25DD31 pKa = 3.82EE32 pKa = 5.12AVDD35 pKa = 5.27KK36 pKa = 11.39IEE38 pKa = 5.8DD39 pKa = 4.22YY40 pKa = 11.07IDD42 pKa = 3.63NPQSFNYY49 pKa = 9.94KK50 pKa = 10.11SIRR53 pKa = 11.84LTPYY57 pKa = 10.4NPDD60 pKa = 2.99INGDD64 pKa = 3.87VIATDD69 pKa = 3.0ILLRR73 pKa = 11.84LDD75 pKa = 4.43DD76 pKa = 5.2IIYY79 pKa = 10.64VDD81 pKa = 4.85ASCEE85 pKa = 4.09TIKK88 pKa = 11.18YY89 pKa = 8.87EE90 pKa = 4.28EE91 pKa = 4.41PKK93 pKa = 10.91AA94 pKa = 3.71
MM1 pKa = 7.39EE2 pKa = 5.86RR3 pKa = 11.84IKK5 pKa = 10.12TLFHH9 pKa = 6.5VIYY12 pKa = 11.06NNGTHH17 pKa = 6.78LEE19 pKa = 4.13VAALFDD25 pKa = 4.58TIDD28 pKa = 4.54DD29 pKa = 3.67YY30 pKa = 12.25DD31 pKa = 3.82EE32 pKa = 5.12AVDD35 pKa = 5.27KK36 pKa = 11.39IEE38 pKa = 5.8DD39 pKa = 4.22YY40 pKa = 11.07IDD42 pKa = 3.63NPQSFNYY49 pKa = 9.94KK50 pKa = 10.11SIRR53 pKa = 11.84LTPYY57 pKa = 10.4NPDD60 pKa = 2.99INGDD64 pKa = 3.87VIATDD69 pKa = 3.0ILLRR73 pKa = 11.84LDD75 pKa = 4.43DD76 pKa = 5.2IIYY79 pKa = 10.64VDD81 pKa = 4.85ASCEE85 pKa = 4.09TIKK88 pKa = 11.18YY89 pKa = 8.87EE90 pKa = 4.28EE91 pKa = 4.41PKK93 pKa = 10.91AA94 pKa = 3.71
Molecular weight: 10.88 kDa
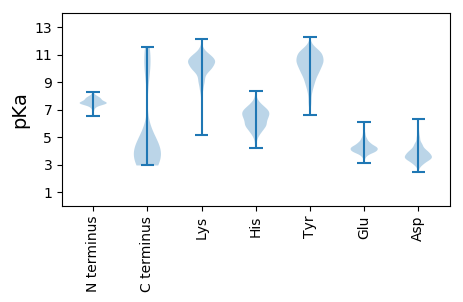
Isoelectric point according different methods:
Protein with the highest isoelectric point:
>tr|A0A1U9WRA5|A0A1U9WRA5_9CAUD RecA OS=Streptococcus virus MS1 OX=1962672 GN=MS1_12 PE=3 SV=1
MM1 pKa = 7.35AQRR4 pKa = 11.84TLFSRR9 pKa = 11.84PSGPKK14 pKa = 8.41VSKK17 pKa = 9.88PIKK20 pKa = 9.85RR21 pKa = 11.84RR22 pKa = 11.84PKK24 pKa = 8.26VQLDD28 pKa = 3.71RR29 pKa = 11.84EE30 pKa = 4.28VLEE33 pKa = 5.1LINRR37 pKa = 11.84RR38 pKa = 11.84QRR40 pKa = 11.84QILVHH45 pKa = 6.19SNLYY49 pKa = 9.46YY50 pKa = 10.05RR51 pKa = 11.84QNVNLITDD59 pKa = 3.97AQYY62 pKa = 11.59DD63 pKa = 3.68RR64 pKa = 11.84WSHH67 pKa = 4.96QLYY70 pKa = 10.85DD71 pKa = 5.49LIQDD75 pKa = 3.54HH76 pKa = 6.81PKK78 pKa = 10.56EE79 pKa = 4.2FRR81 pKa = 11.84KK82 pKa = 10.14SAWYY86 pKa = 9.22EE87 pKa = 3.58AFRR90 pKa = 11.84TFDD93 pKa = 3.49GNTGMGLPYY102 pKa = 9.72TDD104 pKa = 3.57PWVEE108 pKa = 4.11GTATHH113 pKa = 7.15LLKK116 pKa = 10.59ISGGQPTT123 pKa = 3.85
MM1 pKa = 7.35AQRR4 pKa = 11.84TLFSRR9 pKa = 11.84PSGPKK14 pKa = 8.41VSKK17 pKa = 9.88PIKK20 pKa = 9.85RR21 pKa = 11.84RR22 pKa = 11.84PKK24 pKa = 8.26VQLDD28 pKa = 3.71RR29 pKa = 11.84EE30 pKa = 4.28VLEE33 pKa = 5.1LINRR37 pKa = 11.84RR38 pKa = 11.84QRR40 pKa = 11.84QILVHH45 pKa = 6.19SNLYY49 pKa = 9.46YY50 pKa = 10.05RR51 pKa = 11.84QNVNLITDD59 pKa = 3.97AQYY62 pKa = 11.59DD63 pKa = 3.68RR64 pKa = 11.84WSHH67 pKa = 4.96QLYY70 pKa = 10.85DD71 pKa = 5.49LIQDD75 pKa = 3.54HH76 pKa = 6.81PKK78 pKa = 10.56EE79 pKa = 4.2FRR81 pKa = 11.84KK82 pKa = 10.14SAWYY86 pKa = 9.22EE87 pKa = 3.58AFRR90 pKa = 11.84TFDD93 pKa = 3.49GNTGMGLPYY102 pKa = 9.72TDD104 pKa = 3.57PWVEE108 pKa = 4.11GTATHH113 pKa = 7.15LLKK116 pKa = 10.59ISGGQPTT123 pKa = 3.85
Molecular weight: 14.48 kDa
Isoelectric point according different methods:
Peptides (in silico digests for buttom-up proteomics)
Below you can find in silico digests of the whole proteome with Trypsin, Chymotrypsin, Trypsin+LysC, LysN, ArgC proteases suitable for different mass spec machines.| Try ESI |
 |
|---|
| ChTry ESI |
 |
|---|
| ArgC ESI |
 |
|---|
| LysN ESI |
 |
|---|
| TryLysC ESI |
 |
|---|
| Try MALDI |
 |
|---|
| ChTry MALDI |
 |
|---|
| ArgC MALDI |
 |
|---|
| LysN MALDI |
 |
|---|
| TryLysC MALDI |
 |
|---|
| Try LTQ |
 |
|---|
| ChTry LTQ |
 |
|---|
| ArgC LTQ |
 |
|---|
| LysN LTQ |
 |
|---|
| TryLysC LTQ |
 |
|---|
| Try MSlow |
 |
|---|
| ChTry MSlow |
 |
|---|
| ArgC MSlow |
 |
|---|
| LysN MSlow |
 |
|---|
| TryLysC MSlow |
 |
|---|
| Try MShigh |
 |
|---|
| ChTry MShigh |
 |
|---|
| ArgC MShigh |
 |
|---|
| LysN MShigh |
 |
|---|
| TryLysC MShigh |
 |
|---|
General Statistics
Number of major isoforms |
Number of additional isoforms |
Number of all proteins |
Number of amino acids |
Min. Seq. Length |
Max. Seq. Length |
Avg. Seq. Length |
Avg. Mol. Weight |
|---|---|---|---|---|---|---|---|
0 |
17720 |
31 |
1226 |
230.1 |
26.0 |
Amino acid frequency
Ala |
Cys |
Asp |
Glu |
Phe |
Gly |
His |
Ile |
Lys |
Leu |
|---|---|---|---|---|---|---|---|---|---|
6.896 ± 0.441 | 0.892 ± 0.124 |
6.23 ± 0.288 | 7.269 ± 0.426 |
3.984 ± 0.203 | 6.721 ± 0.355 |
1.524 ± 0.115 | 6.456 ± 0.274 |
7.156 ± 0.301 | 8.781 ± 0.329 |
Met |
Asn |
Gln |
Pro |
Arg |
Ser |
Thr |
Val |
Trp |
Tyr |
|---|---|---|---|---|---|---|---|---|---|
2.619 ± 0.18 | 4.972 ± 0.256 |
3.476 ± 0.159 | 4.255 ± 0.192 |
4.644 ± 0.234 | 5.971 ± 0.247 |
6.078 ± 0.255 | 6.597 ± 0.185 |
1.287 ± 0.129 | 4.193 ± 0.271 |
Most of the basic statistics you can see at this page can be downloaded from this CSV file
Proteome-pI is available under Creative Commons Attribution-NoDerivs license, for more details see here
| Reference: Kozlowski LP. Proteome-pI 2.0: Proteome Isoelectric Point Database Update. Nucleic Acids Res. 2021, doi: 10.1093/nar/gkab944 | Contact: Lukasz P. Kozlowski |
