Apis mellifera associated microvirus 39
Taxonomy: Viruses; Monodnaviria; Sangervirae; Phixviricota; Malgrandaviricetes; Petitvirales; Microviridae; unclassified Microviridae
Average proteome isoelectric point is 7.58
Get precalculated fractions of proteins

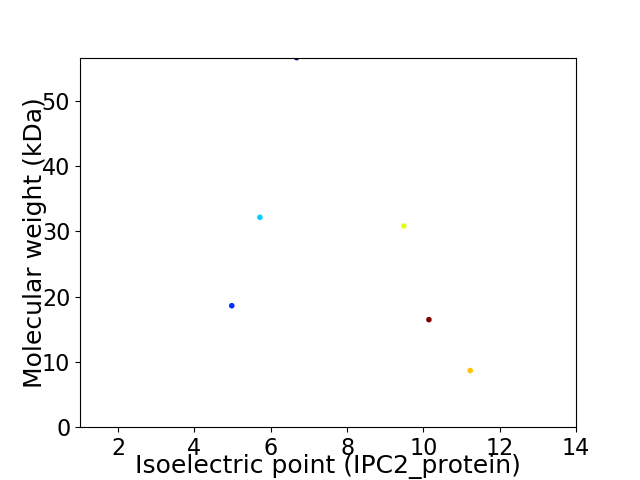
Virtual 2D-PAGE plot for 6 proteins (isoelectric point calculated using IPC2_protein)
Get csv file with sequences according to given criteria:
* You can choose from 21 different methods for calculating isoelectric point
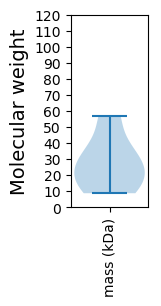
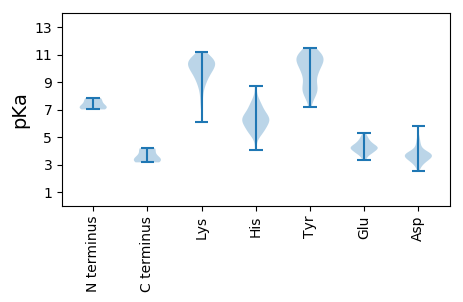
Summary statistics related to proteome-wise predictions


Protein with the lowest isoelectric point:
>tr|A0A3S8UU29|A0A3S8UU29_9VIRU Uncharacterized protein OS=Apis mellifera associated microvirus 39 OX=2494768 PE=4 SV=1
MM1 pKa = 7.12ATKK4 pKa = 10.58DD5 pKa = 3.21SDD7 pKa = 3.93DD8 pKa = 3.58QVGPKK13 pKa = 9.94QPVYY17 pKa = 10.47PRR19 pKa = 11.84LDD21 pKa = 3.5EE22 pKa = 5.3HH23 pKa = 6.43GHH25 pKa = 5.35EE26 pKa = 4.65VPDD29 pKa = 4.42PRR31 pKa = 11.84PMAIPAGFRR40 pKa = 11.84RR41 pKa = 11.84PEE43 pKa = 3.77TLAEE47 pKa = 3.87QVQRR51 pKa = 11.84LVRR54 pKa = 11.84THH56 pKa = 7.6ISMQAQNEE64 pKa = 4.31GFEE67 pKa = 4.44SFEE70 pKa = 3.95EE71 pKa = 5.2AEE73 pKa = 4.73DD74 pKa = 4.06FDD76 pKa = 5.8IEE78 pKa = 4.59DD79 pKa = 3.77DD80 pKa = 3.76HH81 pKa = 8.74GEE83 pKa = 3.91PTTPYY88 pKa = 8.58EE89 pKa = 4.29TEE91 pKa = 3.81FDD93 pKa = 3.67PVLGRR98 pKa = 11.84EE99 pKa = 3.83ITPAEE104 pKa = 4.07FSLHH108 pKa = 4.06QEE110 pKa = 4.14RR111 pKa = 11.84YY112 pKa = 8.22RR113 pKa = 11.84RR114 pKa = 11.84EE115 pKa = 3.86MLDD118 pKa = 2.93RR119 pKa = 11.84QARR122 pKa = 11.84HH123 pKa = 5.2FARR126 pKa = 11.84RR127 pKa = 11.84DD128 pKa = 3.43LEE130 pKa = 4.59HH131 pKa = 7.12EE132 pKa = 4.39VAQPRR137 pKa = 11.84SRR139 pKa = 11.84KK140 pKa = 9.35QPAKK144 pKa = 10.64DD145 pKa = 3.74AGDD148 pKa = 4.1PPAKK152 pKa = 9.64PAAKK156 pKa = 9.7EE157 pKa = 4.08PPSPTGG163 pKa = 3.16
MM1 pKa = 7.12ATKK4 pKa = 10.58DD5 pKa = 3.21SDD7 pKa = 3.93DD8 pKa = 3.58QVGPKK13 pKa = 9.94QPVYY17 pKa = 10.47PRR19 pKa = 11.84LDD21 pKa = 3.5EE22 pKa = 5.3HH23 pKa = 6.43GHH25 pKa = 5.35EE26 pKa = 4.65VPDD29 pKa = 4.42PRR31 pKa = 11.84PMAIPAGFRR40 pKa = 11.84RR41 pKa = 11.84PEE43 pKa = 3.77TLAEE47 pKa = 3.87QVQRR51 pKa = 11.84LVRR54 pKa = 11.84THH56 pKa = 7.6ISMQAQNEE64 pKa = 4.31GFEE67 pKa = 4.44SFEE70 pKa = 3.95EE71 pKa = 5.2AEE73 pKa = 4.73DD74 pKa = 4.06FDD76 pKa = 5.8IEE78 pKa = 4.59DD79 pKa = 3.77DD80 pKa = 3.76HH81 pKa = 8.74GEE83 pKa = 3.91PTTPYY88 pKa = 8.58EE89 pKa = 4.29TEE91 pKa = 3.81FDD93 pKa = 3.67PVLGRR98 pKa = 11.84EE99 pKa = 3.83ITPAEE104 pKa = 4.07FSLHH108 pKa = 4.06QEE110 pKa = 4.14RR111 pKa = 11.84YY112 pKa = 8.22RR113 pKa = 11.84RR114 pKa = 11.84EE115 pKa = 3.86MLDD118 pKa = 2.93RR119 pKa = 11.84QARR122 pKa = 11.84HH123 pKa = 5.2FARR126 pKa = 11.84RR127 pKa = 11.84DD128 pKa = 3.43LEE130 pKa = 4.59HH131 pKa = 7.12EE132 pKa = 4.39VAQPRR137 pKa = 11.84SRR139 pKa = 11.84KK140 pKa = 9.35QPAKK144 pKa = 10.64DD145 pKa = 3.74AGDD148 pKa = 4.1PPAKK152 pKa = 9.64PAAKK156 pKa = 9.7EE157 pKa = 4.08PPSPTGG163 pKa = 3.16
Molecular weight: 18.61 kDa
Isoelectric point according different methods:
Protein with the highest isoelectric point:
>tr|A0A3S8UU38|A0A3S8UU38_9VIRU DNA pilot protein OS=Apis mellifera associated microvirus 39 OX=2494768 PE=4 SV=1
MM1 pKa = 7.84RR2 pKa = 11.84NGGFTRR8 pKa = 11.84SFRR11 pKa = 11.84STAFAKK17 pKa = 10.35RR18 pKa = 11.84PARR21 pKa = 11.84MCPRR25 pKa = 11.84AGQPSQGHH33 pKa = 5.42HH34 pKa = 6.46RR35 pKa = 11.84RR36 pKa = 11.84TAMRR40 pKa = 11.84YY41 pKa = 7.21RR42 pKa = 11.84RR43 pKa = 11.84RR44 pKa = 11.84RR45 pKa = 11.84RR46 pKa = 11.84SLRR49 pKa = 11.84RR50 pKa = 11.84RR51 pKa = 11.84SRR53 pKa = 11.84VRR55 pKa = 11.84RR56 pKa = 11.84LRR58 pKa = 11.84RR59 pKa = 11.84GRR61 pKa = 11.84GRR63 pKa = 11.84PMRR66 pKa = 11.84IGFRR70 pKa = 11.84MM71 pKa = 3.48
MM1 pKa = 7.84RR2 pKa = 11.84NGGFTRR8 pKa = 11.84SFRR11 pKa = 11.84STAFAKK17 pKa = 10.35RR18 pKa = 11.84PARR21 pKa = 11.84MCPRR25 pKa = 11.84AGQPSQGHH33 pKa = 5.42HH34 pKa = 6.46RR35 pKa = 11.84RR36 pKa = 11.84TAMRR40 pKa = 11.84YY41 pKa = 7.21RR42 pKa = 11.84RR43 pKa = 11.84RR44 pKa = 11.84RR45 pKa = 11.84RR46 pKa = 11.84SLRR49 pKa = 11.84RR50 pKa = 11.84RR51 pKa = 11.84SRR53 pKa = 11.84VRR55 pKa = 11.84RR56 pKa = 11.84LRR58 pKa = 11.84RR59 pKa = 11.84GRR61 pKa = 11.84GRR63 pKa = 11.84PMRR66 pKa = 11.84IGFRR70 pKa = 11.84MM71 pKa = 3.48
Molecular weight: 8.68 kDa
Isoelectric point according different methods:
Peptides (in silico digests for buttom-up proteomics)
Below you can find in silico digests of the whole proteome with Trypsin, Chymotrypsin, Trypsin+LysC, LysN, ArgC proteases suitable for different mass spec machines.| Try ESI |
 |
|---|
| ChTry ESI |
 |
|---|
| ArgC ESI |
 |
|---|
| LysN ESI |
 |
|---|
| TryLysC ESI |
 |
|---|
| Try MALDI |
 |
|---|
| ChTry MALDI |
 |
|---|
| ArgC MALDI |
 |
|---|
| LysN MALDI |
 |
|---|
| TryLysC MALDI |
 |
|---|
| Try LTQ |
 |
|---|
| ChTry LTQ |
 |
|---|
| ArgC LTQ |
 |
|---|
| LysN LTQ |
 |
|---|
| TryLysC LTQ |
 |
|---|
| Try MSlow |
 |
|---|
| ChTry MSlow |
 |
|---|
| ArgC MSlow |
 |
|---|
| LysN MSlow |
 |
|---|
| TryLysC MSlow |
 |
|---|
| Try MShigh |
 |
|---|
| ChTry MShigh |
 |
|---|
| ArgC MShigh |
 |
|---|
| LysN MShigh |
 |
|---|
| TryLysC MShigh |
 |
|---|
General Statistics
Number of major isoforms |
Number of additional isoforms |
Number of all proteins |
Number of amino acids |
Min. Seq. Length |
Max. Seq. Length |
Avg. Seq. Length |
Avg. Mol. Weight |
|---|---|---|---|---|---|---|---|
0 |
1456 |
71 |
506 |
242.7 |
27.23 |
Amino acid frequency
Ala |
Cys |
Asp |
Glu |
Phe |
Gly |
His |
Ile |
Lys |
Leu |
|---|---|---|---|---|---|---|---|---|---|
9.478 ± 1.344 | 0.687 ± 0.39 |
4.602 ± 0.615 | 5.838 ± 0.944 |
3.64 ± 0.393 | 7.692 ± 0.622 |
2.473 ± 0.394 | 3.915 ± 0.558 |
3.709 ± 0.373 | 7.624 ± 1.065 |
Met |
Asn |
Gln |
Pro |
Arg |
Ser |
Thr |
Val |
Trp |
Tyr |
|---|---|---|---|---|---|---|---|---|---|
1.923 ± 0.44 | 2.816 ± 0.608 |
7.486 ± 1.021 | 5.288 ± 0.784 |
10.234 ± 2.93 | 6.525 ± 0.801 |
5.907 ± 0.839 | 5.426 ± 1.012 |
1.717 ± 0.433 | 3.022 ± 0.972 |
Most of the basic statistics you can see at this page can be downloaded from this CSV file
Proteome-pI is available under Creative Commons Attribution-NoDerivs license, for more details see here
| Reference: Kozlowski LP. Proteome-pI 2.0: Proteome Isoelectric Point Database Update. Nucleic Acids Res. 2021, doi: 10.1093/nar/gkab944 | Contact: Lukasz P. Kozlowski |
