Frankia sp. EI5c
Taxonomy: cellular organisms; Bacteria; Terrabacteria group; Actinobacteria; Actinomycetia; Frankiales; Frankiaceae; Frankia; unclassified Frankia
Average proteome isoelectric point is 6.46
Get precalculated fractions of proteins

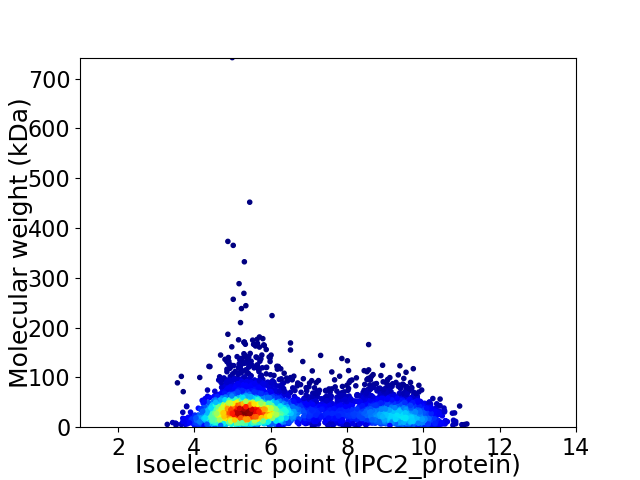
Virtual 2D-PAGE plot for 5384 proteins (isoelectric point calculated using IPC2_protein)
Get csv file with sequences according to given criteria:
* You can choose from 21 different methods for calculating isoelectric point
Summary statistics related to proteome-wise predictions


Protein with the lowest isoelectric point:
>tr|A0A168IFP0|A0A168IFP0_9ACTN Uncharacterized protein OS=Frankia sp. EI5c OX=683316 GN=UG55_10923 PE=4 SV=1
VV1 pKa = 6.88PGGAIRR7 pKa = 11.84FTATYY12 pKa = 9.08TNTGQTPYY20 pKa = 11.26NNITIRR26 pKa = 11.84TSAADD31 pKa = 3.68LSDD34 pKa = 4.12DD35 pKa = 3.82FVGIGDD41 pKa = 3.64QTASSGVISIDD52 pKa = 3.14EE53 pKa = 4.2LTFEE57 pKa = 4.74SVWTGSIPVGGTVTLTGSGTVLDD80 pKa = 4.91PDD82 pKa = 4.15PGNRR86 pKa = 11.84DD87 pKa = 2.87IVTVVHH93 pKa = 5.67TTAXGSNCPVGNPAPACRR111 pKa = 11.84VSVPVLLPGLTMTTAADD128 pKa = 3.54VPTAVPGGVVNYY140 pKa = 8.27TVTITNSGEE149 pKa = 4.13TPYY152 pKa = 10.65TGAAVANNLTGALDD166 pKa = 3.77DD167 pKa = 4.19AVYY170 pKa = 10.67GGDD173 pKa = 3.32ATASTGSVAFAGQTLTWTGDD193 pKa = 3.42LGVGQVATVTYY204 pKa = 10.26SLTVRR209 pKa = 11.84NPDD212 pKa = 3.61PGDD215 pKa = 3.13KK216 pKa = 10.69VMRR219 pKa = 11.84NILSSTVQGSACPPNSGNTGCAGSVAVLTXALTIAKK255 pKa = 9.5SASTATXLPGEE266 pKa = 4.39AVTFTIAVSNTGQVPFPGATVVDD289 pKa = 3.92AXGGVLDD296 pKa = 4.42DD297 pKa = 3.72ATYY300 pKa = 11.18NGDD303 pKa = 3.54AGTTAGTVDD312 pKa = 3.51VTGSTLTWTGDD323 pKa = 3.7LNPGGSATVTYY334 pKa = 10.8SVTLLGNGLGSGDD347 pKa = 4.02GILANSATSXVAGNNCPTGGTDD369 pKa = 3.54PRR371 pKa = 11.84CSATVRR377 pKa = 11.84RR378 pKa = 11.84SEE380 pKa = 4.32LNISFTGNRR389 pKa = 11.84STAGPGEE396 pKa = 4.48VISRR400 pKa = 11.84IATITNTGQVPYY412 pKa = 9.97TGATVYY418 pKa = 10.75LSNDD422 pKa = 3.13DD423 pKa = 3.93TQNLLSYY430 pKa = 10.74NGDD433 pKa = 3.26ASTTTGSIQFDD444 pKa = 4.1LVNLRR449 pKa = 11.84IVWTGDD455 pKa = 3.38LAPXQAATITASSTVRR471 pKa = 11.84PVTQGGEE478 pKa = 4.24VTSVAEE484 pKa = 4.27SPTPGSNCPIGGSDD498 pKa = 3.67PACSNLLTVLKK509 pKa = 9.83PQLTIVKK516 pKa = 8.39TPSTTTTVPGGTITWTVTISNTGEE540 pKa = 3.85TAYY543 pKa = 9.76TGATVTDD550 pKa = 4.71DD551 pKa = 3.86LTGLAQDD558 pKa = 3.48TDD560 pKa = 4.28YY561 pKa = 11.84NGDD564 pKa = 3.33ATATTGALGYY574 pKa = 9.61SAPLLTWTGDD584 pKa = 3.77LAVGASATITFTTTVHH600 pKa = 5.17QQIQGPHH607 pKa = 5.96ALFNTVRR614 pKa = 11.84SAEE617 pKa = 4.24LGSTCPPSGGNAPGPCRR634 pKa = 11.84ALVLILIPQLTITKK648 pKa = 8.61TAATGSPAGTAVAXSPIDD666 pKa = 3.54YY667 pKa = 8.71TVTVANTGEE676 pKa = 4.21TPYY679 pKa = 10.21TGASFTDD686 pKa = 3.99DD687 pKa = 3.72LTDD690 pKa = 3.59VLDD693 pKa = 4.34DD694 pKa = 3.57AAYY697 pKa = 10.84NGDD700 pKa = 3.68AAXTTGTVDD709 pKa = 3.82FTDD712 pKa = 5.54PEE714 pKa = 4.49LTWTGDD720 pKa = 3.57LAIGATATITYY731 pKa = 10.08SVTTALPANGNHH743 pKa = 6.12TATNAVSSATPGTNCLAGGTDD764 pKa = 3.81TACTTTTTVLVPALSITKK782 pKa = 10.29AVDD785 pKa = 3.02QASIVTGGTVHH796 pKa = 5.36YY797 pKa = 8.8TITATNTGEE806 pKa = 4.19SPYY809 pKa = 11.0SGITITDD816 pKa = 3.7TLDD819 pKa = 3.89DD820 pKa = 4.17LAGNATWVGDD830 pKa = 3.73AAATTGTVDD839 pKa = 3.69FTDD842 pKa = 5.09PVLTWTGDD850 pKa = 3.62LAIXASVTITYY861 pKa = 10.37SVAVDD866 pKa = 3.73DD867 pKa = 4.54AAXXGAVLANRR878 pKa = 11.84VVSPAPGSTCTGLGTEE894 pKa = 4.75PACEE898 pKa = 3.71TSTTIDD904 pKa = 3.52AQTLTLTNLTDD915 pKa = 3.29SFTFSGQPQDD925 pKa = 5.06ALTLHH930 pKa = 6.62NAVTMTVITNSADD943 pKa = 3.24GYY945 pKa = 7.74TVSVQGTGPTLTAQNPANDD964 pKa = 3.69DD965 pKa = 4.26TIPLDD970 pKa = 3.76ALSVRR975 pKa = 11.84GTGQAGFQPLSEE987 pKa = 4.3TTPXLAHH994 pKa = 6.37SQDD997 pKa = 3.77APSAPGGDD1005 pKa = 4.04AISNDD1010 pKa = 3.49FSVDD1014 pKa = 3.14IPFVASDD1021 pKa = 4.1TYY1023 pKa = 11.05STTLDD1028 pKa = 3.5YY1029 pKa = 10.91IAATKK1034 pKa = 10.23
VV1 pKa = 6.88PGGAIRR7 pKa = 11.84FTATYY12 pKa = 9.08TNTGQTPYY20 pKa = 11.26NNITIRR26 pKa = 11.84TSAADD31 pKa = 3.68LSDD34 pKa = 4.12DD35 pKa = 3.82FVGIGDD41 pKa = 3.64QTASSGVISIDD52 pKa = 3.14EE53 pKa = 4.2LTFEE57 pKa = 4.74SVWTGSIPVGGTVTLTGSGTVLDD80 pKa = 4.91PDD82 pKa = 4.15PGNRR86 pKa = 11.84DD87 pKa = 2.87IVTVVHH93 pKa = 5.67TTAXGSNCPVGNPAPACRR111 pKa = 11.84VSVPVLLPGLTMTTAADD128 pKa = 3.54VPTAVPGGVVNYY140 pKa = 8.27TVTITNSGEE149 pKa = 4.13TPYY152 pKa = 10.65TGAAVANNLTGALDD166 pKa = 3.77DD167 pKa = 4.19AVYY170 pKa = 10.67GGDD173 pKa = 3.32ATASTGSVAFAGQTLTWTGDD193 pKa = 3.42LGVGQVATVTYY204 pKa = 10.26SLTVRR209 pKa = 11.84NPDD212 pKa = 3.61PGDD215 pKa = 3.13KK216 pKa = 10.69VMRR219 pKa = 11.84NILSSTVQGSACPPNSGNTGCAGSVAVLTXALTIAKK255 pKa = 9.5SASTATXLPGEE266 pKa = 4.39AVTFTIAVSNTGQVPFPGATVVDD289 pKa = 3.92AXGGVLDD296 pKa = 4.42DD297 pKa = 3.72ATYY300 pKa = 11.18NGDD303 pKa = 3.54AGTTAGTVDD312 pKa = 3.51VTGSTLTWTGDD323 pKa = 3.7LNPGGSATVTYY334 pKa = 10.8SVTLLGNGLGSGDD347 pKa = 4.02GILANSATSXVAGNNCPTGGTDD369 pKa = 3.54PRR371 pKa = 11.84CSATVRR377 pKa = 11.84RR378 pKa = 11.84SEE380 pKa = 4.32LNISFTGNRR389 pKa = 11.84STAGPGEE396 pKa = 4.48VISRR400 pKa = 11.84IATITNTGQVPYY412 pKa = 9.97TGATVYY418 pKa = 10.75LSNDD422 pKa = 3.13DD423 pKa = 3.93TQNLLSYY430 pKa = 10.74NGDD433 pKa = 3.26ASTTTGSIQFDD444 pKa = 4.1LVNLRR449 pKa = 11.84IVWTGDD455 pKa = 3.38LAPXQAATITASSTVRR471 pKa = 11.84PVTQGGEE478 pKa = 4.24VTSVAEE484 pKa = 4.27SPTPGSNCPIGGSDD498 pKa = 3.67PACSNLLTVLKK509 pKa = 9.83PQLTIVKK516 pKa = 8.39TPSTTTTVPGGTITWTVTISNTGEE540 pKa = 3.85TAYY543 pKa = 9.76TGATVTDD550 pKa = 4.71DD551 pKa = 3.86LTGLAQDD558 pKa = 3.48TDD560 pKa = 4.28YY561 pKa = 11.84NGDD564 pKa = 3.33ATATTGALGYY574 pKa = 9.61SAPLLTWTGDD584 pKa = 3.77LAVGASATITFTTTVHH600 pKa = 5.17QQIQGPHH607 pKa = 5.96ALFNTVRR614 pKa = 11.84SAEE617 pKa = 4.24LGSTCPPSGGNAPGPCRR634 pKa = 11.84ALVLILIPQLTITKK648 pKa = 8.61TAATGSPAGTAVAXSPIDD666 pKa = 3.54YY667 pKa = 8.71TVTVANTGEE676 pKa = 4.21TPYY679 pKa = 10.21TGASFTDD686 pKa = 3.99DD687 pKa = 3.72LTDD690 pKa = 3.59VLDD693 pKa = 4.34DD694 pKa = 3.57AAYY697 pKa = 10.84NGDD700 pKa = 3.68AAXTTGTVDD709 pKa = 3.82FTDD712 pKa = 5.54PEE714 pKa = 4.49LTWTGDD720 pKa = 3.57LAIGATATITYY731 pKa = 10.08SVTTALPANGNHH743 pKa = 6.12TATNAVSSATPGTNCLAGGTDD764 pKa = 3.81TACTTTTTVLVPALSITKK782 pKa = 10.29AVDD785 pKa = 3.02QASIVTGGTVHH796 pKa = 5.36YY797 pKa = 8.8TITATNTGEE806 pKa = 4.19SPYY809 pKa = 11.0SGITITDD816 pKa = 3.7TLDD819 pKa = 3.89DD820 pKa = 4.17LAGNATWVGDD830 pKa = 3.73AAATTGTVDD839 pKa = 3.69FTDD842 pKa = 5.09PVLTWTGDD850 pKa = 3.62LAIXASVTITYY861 pKa = 10.37SVAVDD866 pKa = 3.73DD867 pKa = 4.54AAXXGAVLANRR878 pKa = 11.84VVSPAPGSTCTGLGTEE894 pKa = 4.75PACEE898 pKa = 3.71TSTTIDD904 pKa = 3.52AQTLTLTNLTDD915 pKa = 3.29SFTFSGQPQDD925 pKa = 5.06ALTLHH930 pKa = 6.62NAVTMTVITNSADD943 pKa = 3.24GYY945 pKa = 7.74TVSVQGTGPTLTAQNPANDD964 pKa = 3.69DD965 pKa = 4.26TIPLDD970 pKa = 3.76ALSVRR975 pKa = 11.84GTGQAGFQPLSEE987 pKa = 4.3TTPXLAHH994 pKa = 6.37SQDD997 pKa = 3.77APSAPGGDD1005 pKa = 4.04AISNDD1010 pKa = 3.49FSVDD1014 pKa = 3.14IPFVASDD1021 pKa = 4.1TYY1023 pKa = 11.05STTLDD1028 pKa = 3.5YY1029 pKa = 10.91IAATKK1034 pKa = 10.23
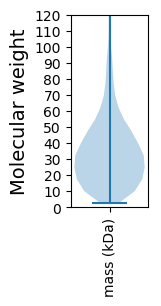
Molecular weight: 102.04 kDa
Isoelectric point according different methods:
Protein with the highest isoelectric point:
>tr|A0A166QV47|A0A166QV47_9ACTN Uncharacterized protein OS=Frankia sp. EI5c OX=683316 GN=UG55_103053 PE=4 SV=1
MM1 pKa = 7.36ARR3 pKa = 11.84ARR5 pKa = 11.84VPAVARR11 pKa = 11.84ARR13 pKa = 11.84APVAVPLAVAPVAVAVPVPVAVAVAVAVVAATVVVAARR51 pKa = 11.84RR52 pKa = 11.84KK53 pKa = 9.46RR54 pKa = 11.84RR55 pKa = 3.36
MM1 pKa = 7.36ARR3 pKa = 11.84ARR5 pKa = 11.84VPAVARR11 pKa = 11.84ARR13 pKa = 11.84APVAVPLAVAPVAVAVPVPVAVAVAVAVVAATVVVAARR51 pKa = 11.84RR52 pKa = 11.84KK53 pKa = 9.46RR54 pKa = 11.84RR55 pKa = 3.36
Molecular weight: 5.46 kDa
Isoelectric point according different methods:
Peptides (in silico digests for buttom-up proteomics)
Below you can find in silico digests of the whole proteome with Trypsin, Chymotrypsin, Trypsin+LysC, LysN, ArgC proteases suitable for different mass spec machines.| Try ESI |
 |
|---|
| ChTry ESI |
 |
|---|
| ArgC ESI |
 |
|---|
| LysN ESI |
 |
|---|
| TryLysC ESI |
 |
|---|
| Try MALDI |
 |
|---|
| ChTry MALDI |
 |
|---|
| ArgC MALDI |
 |
|---|
| LysN MALDI |
 |
|---|
| TryLysC MALDI |
 |
|---|
| Try LTQ |
 |
|---|
| ChTry LTQ |
 |
|---|
| ArgC LTQ |
 |
|---|
| LysN LTQ |
 |
|---|
| TryLysC LTQ |
 |
|---|
| Try MSlow |
 |
|---|
| ChTry MSlow |
 |
|---|
| ArgC MSlow |
 |
|---|
| LysN MSlow |
 |
|---|
| TryLysC MSlow |
 |
|---|
| Try MShigh |
 |
|---|
| ChTry MShigh |
 |
|---|
| ArgC MShigh |
 |
|---|
| LysN MShigh |
 |
|---|
| TryLysC MShigh |
 |
|---|
General Statistics
Number of major isoforms |
Number of additional isoforms |
Number of all proteins |
Number of amino acids |
Min. Seq. Length |
Max. Seq. Length |
Avg. Seq. Length |
Avg. Mol. Weight |
|---|---|---|---|---|---|---|---|
0 |
1870666 |
22 |
7080 |
347.4 |
36.76 |
Amino acid frequency
Ala |
Cys |
Asp |
Glu |
Phe |
Gly |
His |
Ile |
Lys |
Leu |
|---|---|---|---|---|---|---|---|---|---|
14.416 ± 0.051 | 0.766 ± 0.01 |
5.953 ± 0.026 | 5.185 ± 0.029 |
2.595 ± 0.017 | 9.988 ± 0.036 |
2.07 ± 0.014 | 3.261 ± 0.02 |
1.309 ± 0.02 | 10.158 ± 0.04 |
Met |
Asn |
Gln |
Pro |
Arg |
Ser |
Thr |
Val |
Trp |
Tyr |
|---|---|---|---|---|---|---|---|---|---|
1.542 ± 0.012 | 1.612 ± 0.016 |
6.802 ± 0.033 | 2.488 ± 0.017 |
8.736 ± 0.037 | 5.211 ± 0.022 |
5.95 ± 0.03 | 8.61 ± 0.032 |
1.397 ± 0.013 | 1.808 ± 0.015 |
Most of the basic statistics you can see at this page can be downloaded from this CSV file
Proteome-pI is available under Creative Commons Attribution-NoDerivs license, for more details see here
| Reference: Kozlowski LP. Proteome-pI 2.0: Proteome Isoelectric Point Database Update. Nucleic Acids Res. 2021, doi: 10.1093/nar/gkab944 | Contact: Lukasz P. Kozlowski |
