Virus sp.
Taxonomy: Viruses; unclassified viruses
Average proteome isoelectric point is 8.57
Get precalculated fractions of proteins

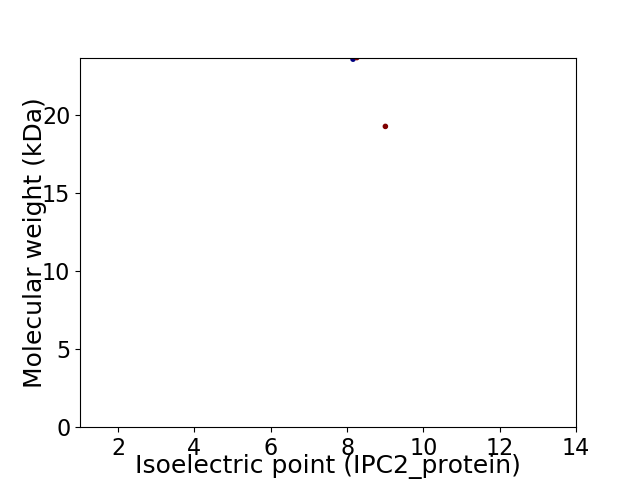
Virtual 2D-PAGE plot for 2 proteins (isoelectric point calculated using IPC2_protein)
Get csv file with sequences according to given criteria:
* You can choose from 21 different methods for calculating isoelectric point
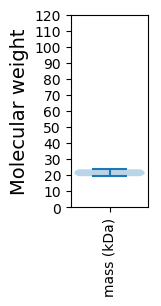
Summary statistics related to proteome-wise predictions


Protein with the lowest isoelectric point:
>tr|A0A345MZT1|A0A345MZT1_9VIRU Coat protein OS=Virus sp. OX=2202649 PE=4 SV=1
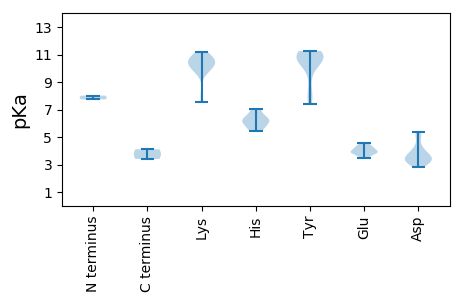
MM1 pKa = 7.74PPQGFSLRR9 pKa = 11.84KK10 pKa = 7.52MSQRR14 pKa = 11.84SRR16 pKa = 11.84QKK18 pKa = 10.94AKK20 pKa = 9.7EE21 pKa = 3.82KK22 pKa = 10.53EE23 pKa = 3.85IAKK26 pKa = 9.78VARR29 pKa = 11.84KK30 pKa = 9.47VLNEE34 pKa = 3.55KK35 pKa = 11.0AEE37 pKa = 4.16LKK39 pKa = 10.51EE40 pKa = 4.6HH41 pKa = 7.03IFGQNTTISTTGSLFCMTEE60 pKa = 3.48VDD62 pKa = 5.03QGDD65 pKa = 4.21AYY67 pKa = 11.17NSRR70 pKa = 11.84DD71 pKa = 3.32GGEE74 pKa = 3.92ISIQGIDD81 pKa = 3.53LRR83 pKa = 11.84YY84 pKa = 7.38TVTYY88 pKa = 11.19ADD90 pKa = 4.04ATNQMRR96 pKa = 11.84VIVFTWNDD104 pKa = 3.21GATNPVTGDD113 pKa = 3.29VLQAPGSWDD122 pKa = 3.15VLSYY126 pKa = 11.14LDD128 pKa = 3.39RR129 pKa = 11.84HH130 pKa = 6.31GDD132 pKa = 3.26VPYY135 pKa = 10.74KK136 pKa = 10.39VLYY139 pKa = 10.75DD140 pKa = 3.52KK141 pKa = 10.73THH143 pKa = 6.46LVDD146 pKa = 3.51NTSNPQKK153 pKa = 10.5NGRR156 pKa = 11.84INLRR160 pKa = 11.84FKK162 pKa = 11.18NGIRR166 pKa = 11.84CYY168 pKa = 10.67YY169 pKa = 10.1NGSQGTDD176 pKa = 3.2YY177 pKa = 11.26GKK179 pKa = 10.2RR180 pKa = 11.84QIWMLCISDD189 pKa = 5.13SIASTHH195 pKa = 5.75PAFRR199 pKa = 11.84GVGYY203 pKa = 10.76VYY205 pKa = 10.73FNDD208 pKa = 3.94FF209 pKa = 3.41
MM1 pKa = 7.74PPQGFSLRR9 pKa = 11.84KK10 pKa = 7.52MSQRR14 pKa = 11.84SRR16 pKa = 11.84QKK18 pKa = 10.94AKK20 pKa = 9.7EE21 pKa = 3.82KK22 pKa = 10.53EE23 pKa = 3.85IAKK26 pKa = 9.78VARR29 pKa = 11.84KK30 pKa = 9.47VLNEE34 pKa = 3.55KK35 pKa = 11.0AEE37 pKa = 4.16LKK39 pKa = 10.51EE40 pKa = 4.6HH41 pKa = 7.03IFGQNTTISTTGSLFCMTEE60 pKa = 3.48VDD62 pKa = 5.03QGDD65 pKa = 4.21AYY67 pKa = 11.17NSRR70 pKa = 11.84DD71 pKa = 3.32GGEE74 pKa = 3.92ISIQGIDD81 pKa = 3.53LRR83 pKa = 11.84YY84 pKa = 7.38TVTYY88 pKa = 11.19ADD90 pKa = 4.04ATNQMRR96 pKa = 11.84VIVFTWNDD104 pKa = 3.21GATNPVTGDD113 pKa = 3.29VLQAPGSWDD122 pKa = 3.15VLSYY126 pKa = 11.14LDD128 pKa = 3.39RR129 pKa = 11.84HH130 pKa = 6.31GDD132 pKa = 3.26VPYY135 pKa = 10.74KK136 pKa = 10.39VLYY139 pKa = 10.75DD140 pKa = 3.52KK141 pKa = 10.73THH143 pKa = 6.46LVDD146 pKa = 3.51NTSNPQKK153 pKa = 10.5NGRR156 pKa = 11.84INLRR160 pKa = 11.84FKK162 pKa = 11.18NGIRR166 pKa = 11.84CYY168 pKa = 10.67YY169 pKa = 10.1NGSQGTDD176 pKa = 3.2YY177 pKa = 11.26GKK179 pKa = 10.2RR180 pKa = 11.84QIWMLCISDD189 pKa = 5.13SIASTHH195 pKa = 5.75PAFRR199 pKa = 11.84GVGYY203 pKa = 10.76VYY205 pKa = 10.73FNDD208 pKa = 3.94FF209 pKa = 3.41
Molecular weight: 23.61 kDa
Isoelectric point according different methods:
Protein with the highest isoelectric point:
>tr|A0A345MZT1|A0A345MZT1_9VIRU Coat protein OS=Virus sp. OX=2202649 PE=4 SV=1
MM1 pKa = 8.02DD2 pKa = 5.4KK3 pKa = 10.72LVEE6 pKa = 3.88QAIVHH11 pKa = 6.51LANNTYY17 pKa = 10.84SDD19 pKa = 3.58WAWAHH24 pKa = 6.01KK25 pKa = 10.14EE26 pKa = 4.19VVKK29 pKa = 11.01SSTFRR34 pKa = 11.84EE35 pKa = 4.11LLQKK39 pKa = 10.03EE40 pKa = 4.11IKK42 pKa = 9.94RR43 pKa = 11.84IKK45 pKa = 10.82NEE47 pKa = 3.88AQQKK51 pKa = 8.13EE52 pKa = 4.36YY53 pKa = 10.64HH54 pKa = 6.25YY55 pKa = 9.55MITFTVSPTLHH66 pKa = 5.85PTIDD70 pKa = 3.61NEE72 pKa = 4.44TEE74 pKa = 3.97KK75 pKa = 10.96QIEE78 pKa = 4.33DD79 pKa = 4.12YY80 pKa = 10.77IRR82 pKa = 11.84SQSDD86 pKa = 3.04RR87 pKa = 11.84TGLHH91 pKa = 5.41VKK93 pKa = 9.68EE94 pKa = 3.74MHH96 pKa = 6.19YY97 pKa = 10.97VKK99 pKa = 10.26EE100 pKa = 3.84LHH102 pKa = 6.96KK103 pKa = 10.64NGRR106 pKa = 11.84PHH108 pKa = 5.52WHH110 pKa = 6.13VSVTTTKK117 pKa = 10.55AIKK120 pKa = 9.88KK121 pKa = 9.97ALFSYY126 pKa = 8.13YY127 pKa = 10.48QKK129 pKa = 10.56IYY131 pKa = 10.96GNIDD135 pKa = 3.56FSRR138 pKa = 11.84SKK140 pKa = 11.09GKK142 pKa = 10.18NNQDD146 pKa = 2.85ALAYY150 pKa = 8.08MSKK153 pKa = 10.44SGTPTKK159 pKa = 10.31LKK161 pKa = 10.51KK162 pKa = 10.2VALL165 pKa = 4.11
MM1 pKa = 8.02DD2 pKa = 5.4KK3 pKa = 10.72LVEE6 pKa = 3.88QAIVHH11 pKa = 6.51LANNTYY17 pKa = 10.84SDD19 pKa = 3.58WAWAHH24 pKa = 6.01KK25 pKa = 10.14EE26 pKa = 4.19VVKK29 pKa = 11.01SSTFRR34 pKa = 11.84EE35 pKa = 4.11LLQKK39 pKa = 10.03EE40 pKa = 4.11IKK42 pKa = 9.94RR43 pKa = 11.84IKK45 pKa = 10.82NEE47 pKa = 3.88AQQKK51 pKa = 8.13EE52 pKa = 4.36YY53 pKa = 10.64HH54 pKa = 6.25YY55 pKa = 9.55MITFTVSPTLHH66 pKa = 5.85PTIDD70 pKa = 3.61NEE72 pKa = 4.44TEE74 pKa = 3.97KK75 pKa = 10.96QIEE78 pKa = 4.33DD79 pKa = 4.12YY80 pKa = 10.77IRR82 pKa = 11.84SQSDD86 pKa = 3.04RR87 pKa = 11.84TGLHH91 pKa = 5.41VKK93 pKa = 9.68EE94 pKa = 3.74MHH96 pKa = 6.19YY97 pKa = 10.97VKK99 pKa = 10.26EE100 pKa = 3.84LHH102 pKa = 6.96KK103 pKa = 10.64NGRR106 pKa = 11.84PHH108 pKa = 5.52WHH110 pKa = 6.13VSVTTTKK117 pKa = 10.55AIKK120 pKa = 9.88KK121 pKa = 9.97ALFSYY126 pKa = 8.13YY127 pKa = 10.48QKK129 pKa = 10.56IYY131 pKa = 10.96GNIDD135 pKa = 3.56FSRR138 pKa = 11.84SKK140 pKa = 11.09GKK142 pKa = 10.18NNQDD146 pKa = 2.85ALAYY150 pKa = 8.08MSKK153 pKa = 10.44SGTPTKK159 pKa = 10.31LKK161 pKa = 10.51KK162 pKa = 10.2VALL165 pKa = 4.11
Molecular weight: 19.3 kDa
Isoelectric point according different methods:
Peptides (in silico digests for buttom-up proteomics)
Below you can find in silico digests of the whole proteome with Trypsin, Chymotrypsin, Trypsin+LysC, LysN, ArgC proteases suitable for different mass spec machines.| Try ESI |
 |
|---|
| ChTry ESI |
 |
|---|
| ArgC ESI |
 |
|---|
| LysN ESI |
 |
|---|
| TryLysC ESI |
 |
|---|
| Try MALDI |
 |
|---|
| ChTry MALDI |
 |
|---|
| ArgC MALDI |
 |
|---|
| LysN MALDI |
 |
|---|
| TryLysC MALDI |
 |
|---|
| Try LTQ |
 |
|---|
| ChTry LTQ |
 |
|---|
| ArgC LTQ |
 |
|---|
| LysN LTQ |
 |
|---|
| TryLysC LTQ |
 |
|---|
| Try MSlow |
 |
|---|
| ChTry MSlow |
 |
|---|
| ArgC MSlow |
 |
|---|
| LysN MSlow |
 |
|---|
| TryLysC MSlow |
 |
|---|
| Try MShigh |
 |
|---|
| ChTry MShigh |
 |
|---|
| ArgC MShigh |
 |
|---|
| LysN MShigh |
 |
|---|
| TryLysC MShigh |
 |
|---|
General Statistics
Number of major isoforms |
Number of additional isoforms |
Number of all proteins |
Number of amino acids |
Min. Seq. Length |
Max. Seq. Length |
Avg. Seq. Length |
Avg. Mol. Weight |
|---|---|---|---|---|---|---|---|
0 |
374 |
165 |
209 |
187.0 |
21.45 |
Amino acid frequency
Ala |
Cys |
Asp |
Glu |
Phe |
Gly |
His |
Ile |
Lys |
Leu |
|---|---|---|---|---|---|---|---|---|---|
5.615 ± 0.272 | 0.802 ± 0.49 |
5.882 ± 1.001 | 4.813 ± 1.132 |
3.209 ± 0.479 | 6.15 ± 1.904 |
3.476 ± 1.208 | 5.882 ± 0.109 |
9.091 ± 2.22 | 6.15 ± 0.316 |
Met |
Asn |
Gln |
Pro |
Arg |
Ser |
Thr |
Val |
Trp |
Tyr |
|---|---|---|---|---|---|---|---|---|---|
2.406 ± 0.011 | 5.615 ± 0.468 |
2.941 ± 0.316 | 5.08 ± 0.141 |
5.08 ± 0.881 | 6.952 ± 0.196 |
7.487 ± 0.239 | 6.417 ± 0.218 |
1.604 ± 0.131 | 5.348 ± 0.065 |
Most of the basic statistics you can see at this page can be downloaded from this CSV file
Proteome-pI is available under Creative Commons Attribution-NoDerivs license, for more details see here
| Reference: Kozlowski LP. Proteome-pI 2.0: Proteome Isoelectric Point Database Update. Nucleic Acids Res. 2021, doi: 10.1093/nar/gkab944 | Contact: Lukasz P. Kozlowski |
