Gopherus agassizii (Agassiz s desert tortoise)
Taxonomy: cellular organisms; Eukaryota; Opisthokonta; Metazoa; Eumetazoa; Bilateria; Deuterostomia; Chordata; Craniata; Vertebrata; Gnathostomata; Teleostomi; Euteleostomi; Sarcopterygii; Dipnotetrapodomorpha; Tetrapoda; Amniota;
Average proteome isoelectric point is 6.66
Get precalculated fractions of proteins

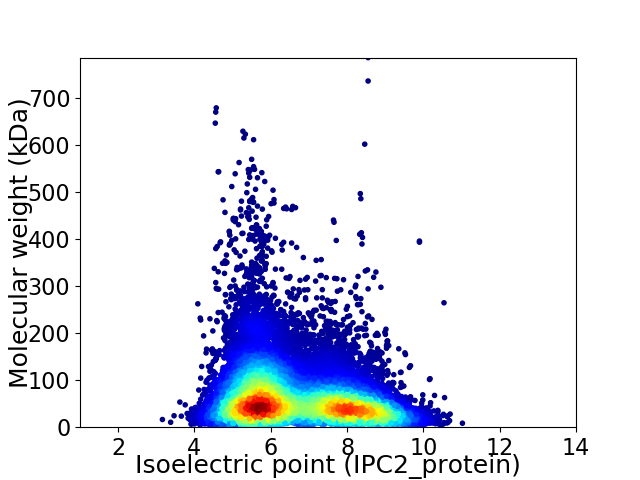
Virtual 2D-PAGE plot for 31812 proteins (isoelectric point calculated using IPC2_protein)
Get csv file with sequences according to given criteria:
* You can choose from 21 different methods for calculating isoelectric point
Summary statistics related to proteome-wise predictions


Protein with the lowest isoelectric point:
>tr|A0A452GN57|A0A452GN57_9SAUR Olfactory receptor OS=Gopherus agassizii OX=38772 PE=3 SV=1
MM1 pKa = 7.6PVLPFPASLHH11 pKa = 5.25GAEE14 pKa = 4.87PLFHH18 pKa = 7.46DD19 pKa = 5.39LDD21 pKa = 5.41SDD23 pKa = 3.99DD24 pKa = 4.49TSLSNLGDD32 pKa = 3.78CFLATSEE39 pKa = 4.47AGPLQSRR46 pKa = 11.84MGNPIDD52 pKa = 4.58QLYY55 pKa = 11.25SMQNSYY61 pKa = 8.25FTSS64 pKa = 3.4
MM1 pKa = 7.6PVLPFPASLHH11 pKa = 5.25GAEE14 pKa = 4.87PLFHH18 pKa = 7.46DD19 pKa = 5.39LDD21 pKa = 5.41SDD23 pKa = 3.99DD24 pKa = 4.49TSLSNLGDD32 pKa = 3.78CFLATSEE39 pKa = 4.47AGPLQSRR46 pKa = 11.84MGNPIDD52 pKa = 4.58QLYY55 pKa = 11.25SMQNSYY61 pKa = 8.25FTSS64 pKa = 3.4
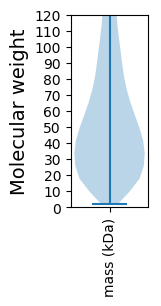
Molecular weight: 6.95 kDa
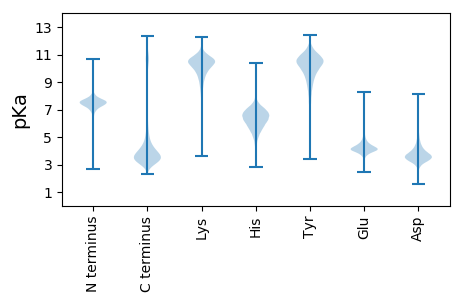
Isoelectric point according different methods:
Protein with the highest isoelectric point:
>tr|A0A452IAC7|A0A452IAC7_9SAUR Chondromodulin OS=Gopherus agassizii OX=38772 PE=3 SV=1
SS1 pKa = 6.64PAGNLGAAITPLSGTGLRR19 pKa = 11.84SPVPPRR25 pKa = 11.84AGTGLRR31 pKa = 11.84SPVPPRR37 pKa = 11.84AGTGLRR43 pKa = 11.84SPVPPRR49 pKa = 11.84AGTGLRR55 pKa = 11.84SPVPPRR61 pKa = 11.84AGTGLRR67 pKa = 11.84SPVPPRR73 pKa = 11.84AGTGLWSPIPPRR85 pKa = 11.84AGTGLRR91 pKa = 11.84SPVPPRR97 pKa = 11.84VAGTGLRR104 pKa = 11.84WPVPPRR110 pKa = 11.84AGTGLRR116 pKa = 11.84SPVPPRR122 pKa = 11.84AGTGLRR128 pKa = 11.84SPVPPRR134 pKa = 11.84AGTGLRR140 pKa = 11.84SPVPPRR146 pKa = 11.84AGTGLRR152 pKa = 11.84SPVPPRR158 pKa = 11.84AGTGLRR164 pKa = 11.84SPVPPRR170 pKa = 11.84AGTGLRR176 pKa = 11.84SPVPPRR182 pKa = 11.84AGTGLRR188 pKa = 11.84SPVPPRR194 pKa = 11.84AGTGLRR200 pKa = 11.84SPVPPRR206 pKa = 11.84AGTGLRR212 pKa = 11.84SPVPPRR218 pKa = 11.84AGTGLRR224 pKa = 11.84SPVPPRR230 pKa = 11.84AGTGLRR236 pKa = 11.84SPVPPRR242 pKa = 11.84AGTGLRR248 pKa = 11.84SPVPPRR254 pKa = 11.84AGTGLRR260 pKa = 11.84WPVPPRR266 pKa = 11.84AGTGLRR272 pKa = 11.84SPVPPRR278 pKa = 11.84AGPGSWTHH286 pKa = 6.3GPLPQPTGGPQRR298 pKa = 11.84GHH300 pKa = 7.13APACPPPPAAPWEE313 pKa = 4.15LGRR316 pKa = 11.84CSLTPGAGPSPLPPAARR333 pKa = 3.88
SS1 pKa = 6.64PAGNLGAAITPLSGTGLRR19 pKa = 11.84SPVPPRR25 pKa = 11.84AGTGLRR31 pKa = 11.84SPVPPRR37 pKa = 11.84AGTGLRR43 pKa = 11.84SPVPPRR49 pKa = 11.84AGTGLRR55 pKa = 11.84SPVPPRR61 pKa = 11.84AGTGLRR67 pKa = 11.84SPVPPRR73 pKa = 11.84AGTGLWSPIPPRR85 pKa = 11.84AGTGLRR91 pKa = 11.84SPVPPRR97 pKa = 11.84VAGTGLRR104 pKa = 11.84WPVPPRR110 pKa = 11.84AGTGLRR116 pKa = 11.84SPVPPRR122 pKa = 11.84AGTGLRR128 pKa = 11.84SPVPPRR134 pKa = 11.84AGTGLRR140 pKa = 11.84SPVPPRR146 pKa = 11.84AGTGLRR152 pKa = 11.84SPVPPRR158 pKa = 11.84AGTGLRR164 pKa = 11.84SPVPPRR170 pKa = 11.84AGTGLRR176 pKa = 11.84SPVPPRR182 pKa = 11.84AGTGLRR188 pKa = 11.84SPVPPRR194 pKa = 11.84AGTGLRR200 pKa = 11.84SPVPPRR206 pKa = 11.84AGTGLRR212 pKa = 11.84SPVPPRR218 pKa = 11.84AGTGLRR224 pKa = 11.84SPVPPRR230 pKa = 11.84AGTGLRR236 pKa = 11.84SPVPPRR242 pKa = 11.84AGTGLRR248 pKa = 11.84SPVPPRR254 pKa = 11.84AGTGLRR260 pKa = 11.84WPVPPRR266 pKa = 11.84AGTGLRR272 pKa = 11.84SPVPPRR278 pKa = 11.84AGPGSWTHH286 pKa = 6.3GPLPQPTGGPQRR298 pKa = 11.84GHH300 pKa = 7.13APACPPPPAAPWEE313 pKa = 4.15LGRR316 pKa = 11.84CSLTPGAGPSPLPPAARR333 pKa = 3.88
Molecular weight: 33.07 kDa
Isoelectric point according different methods:
Peptides (in silico digests for buttom-up proteomics)
Below you can find in silico digests of the whole proteome with Trypsin, Chymotrypsin, Trypsin+LysC, LysN, ArgC proteases suitable for different mass spec machines.| Try ESI |
 |
|---|
| ChTry ESI |
 |
|---|
| ArgC ESI |
 |
|---|
| LysN ESI |
 |
|---|
| TryLysC ESI |
 |
|---|
| Try MALDI |
 |
|---|
| ChTry MALDI |
 |
|---|
| ArgC MALDI |
 |
|---|
| LysN MALDI |
 |
|---|
| TryLysC MALDI |
 |
|---|
| Try LTQ |
 |
|---|
| ChTry LTQ |
 |
|---|
| ArgC LTQ |
 |
|---|
| LysN LTQ |
 |
|---|
| TryLysC LTQ |
 |
|---|
| Try MSlow |
 |
|---|
| ChTry MSlow |
 |
|---|
| ArgC MSlow |
 |
|---|
| LysN MSlow |
 |
|---|
| TryLysC MSlow |
 |
|---|
| Try MShigh |
 |
|---|
| ChTry MShigh |
 |
|---|
| ArgC MShigh |
 |
|---|
| LysN MShigh |
 |
|---|
| TryLysC MShigh |
 |
|---|
General Statistics
Number of major isoforms |
Number of additional isoforms |
Number of all proteins |
Number of amino acids |
Min. Seq. Length |
Max. Seq. Length |
Avg. Seq. Length |
Avg. Mol. Weight |
|---|---|---|---|---|---|---|---|
19797352 |
18 |
6780 |
622.3 |
69.7 |
Amino acid frequency
Ala |
Cys |
Asp |
Glu |
Phe |
Gly |
His |
Ile |
Lys |
Leu |
|---|---|---|---|---|---|---|---|---|---|
6.515 ± 0.012 | 2.281 ± 0.011 |
4.882 ± 0.009 | 7.235 ± 0.018 |
3.689 ± 0.009 | 6.062 ± 0.017 |
2.588 ± 0.006 | 4.856 ± 0.011 |
6.132 ± 0.017 | 9.789 ± 0.018 |
Met |
Asn |
Gln |
Pro |
Arg |
Ser |
Thr |
Val |
Trp |
Tyr |
|---|---|---|---|---|---|---|---|---|---|
2.27 ± 0.006 | 4.018 ± 0.01 |
5.558 ± 0.017 | 4.849 ± 0.011 |
5.343 ± 0.011 | 8.431 ± 0.016 |
5.428 ± 0.009 | 6.027 ± 0.011 |
1.195 ± 0.005 | 2.828 ± 0.008 |
Most of the basic statistics you can see at this page can be downloaded from this CSV file
Proteome-pI is available under Creative Commons Attribution-NoDerivs license, for more details see here
| Reference: Kozlowski LP. Proteome-pI 2.0: Proteome Isoelectric Point Database Update. Nucleic Acids Res. 2021, doi: 10.1093/nar/gkab944 | Contact: Lukasz P. Kozlowski |
