Rhodoferax phage P26218
Taxonomy: Viruses; Duplodnaviria; Heunggongvirae; Uroviricota; Caudoviricetes; Caudovirales; Podoviridae; unclassified Podoviridae
Average proteome isoelectric point is 6.78
Get precalculated fractions of proteins
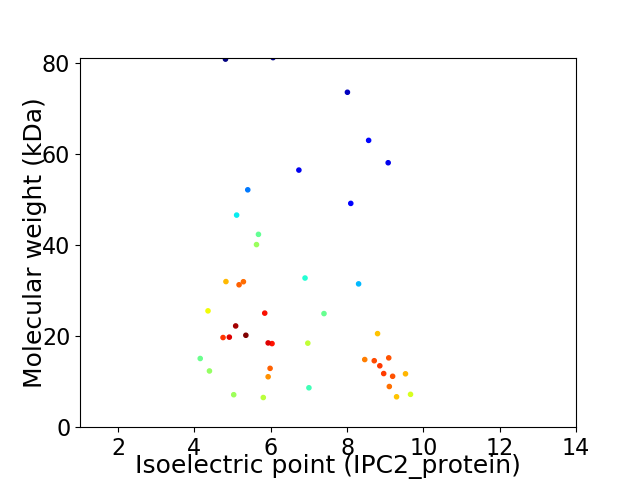
Virtual 2D-PAGE plot for 44 proteins (isoelectric point calculated using IPC2_protein)
Get csv file with sequences according to given criteria:
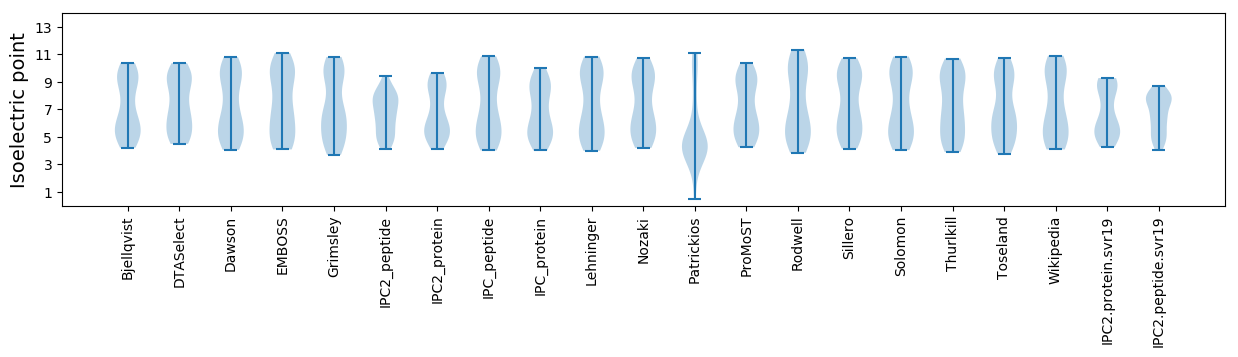
* You can choose from 21 different methods for calculating isoelectric point
Summary statistics related to proteome-wise predictions
Protein with the lowest isoelectric point:
>tr|A0A0E3GMB1|A0A0E3GMB1_9CAUD Portal protein OS=Rhodoferax phage P26218 OX=1636270 GN=P26218_39 PE=4 SV=1
MM1 pKa = 7.93PGPNPSILNMRR12 pKa = 11.84SGQNAIAGGGTQFGWISGDD31 pKa = 3.11IAGLALSATAIAIFDD46 pKa = 5.02LGPNWDD52 pKa = 3.73QYY54 pKa = 11.86NVVQVGVVPAGPSSGLSAVQVFSSDD79 pKa = 3.25DD80 pKa = 3.35AAFNATTDD88 pKa = 3.54VQLNNTWATTFGAISAAITTPQTSGFSPMGRR119 pKa = 11.84YY120 pKa = 10.08LIVRR124 pKa = 11.84ATNADD129 pKa = 3.9GINAQGAGAFIRR141 pKa = 11.84VTAYY145 pKa = 10.01PFVV148 pKa = 3.56
MM1 pKa = 7.93PGPNPSILNMRR12 pKa = 11.84SGQNAIAGGGTQFGWISGDD31 pKa = 3.11IAGLALSATAIAIFDD46 pKa = 5.02LGPNWDD52 pKa = 3.73QYY54 pKa = 11.86NVVQVGVVPAGPSSGLSAVQVFSSDD79 pKa = 3.25DD80 pKa = 3.35AAFNATTDD88 pKa = 3.54VQLNNTWATTFGAISAAITTPQTSGFSPMGRR119 pKa = 11.84YY120 pKa = 10.08LIVRR124 pKa = 11.84ATNADD129 pKa = 3.9GINAQGAGAFIRR141 pKa = 11.84VTAYY145 pKa = 10.01PFVV148 pKa = 3.56
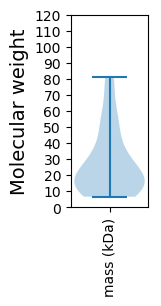
Molecular weight: 15.08 kDa
Isoelectric point according different methods:
Protein with the highest isoelectric point:
>tr|A0A0E3M2S5|A0A0E3M2S5_9CAUD Uncharacterized protein OS=Rhodoferax phage P26218 OX=1636270 GN=P26218_18 PE=4 SV=1
MM1 pKa = 6.82TTTTKK6 pKa = 10.6LVPTFVSSNIGAAAEE21 pKa = 4.01ALFNANRR28 pKa = 11.84ARR30 pKa = 11.84PCACYY35 pKa = 8.81TQDD38 pKa = 3.31GQAVVCSARR47 pKa = 11.84TARR50 pKa = 11.84KK51 pKa = 9.83NGWTIVARR59 pKa = 11.84TWKK62 pKa = 10.55
MM1 pKa = 6.82TTTTKK6 pKa = 10.6LVPTFVSSNIGAAAEE21 pKa = 4.01ALFNANRR28 pKa = 11.84ARR30 pKa = 11.84PCACYY35 pKa = 8.81TQDD38 pKa = 3.31GQAVVCSARR47 pKa = 11.84TARR50 pKa = 11.84KK51 pKa = 9.83NGWTIVARR59 pKa = 11.84TWKK62 pKa = 10.55
Molecular weight: 6.68 kDa
Isoelectric point according different methods:
Peptides (in silico digests for buttom-up proteomics)
Below you can find in silico digests of the whole proteome with Trypsin, Chymotrypsin, Trypsin+LysC, LysN, ArgC proteases suitable for different mass spec machines.| Try ESI |
 |
|---|
| ChTry ESI |
|
|---|
| ArgC ESI |
|
|---|
| LysN ESI |
|
|---|
| TryLysC ESI |
|
|---|
| Try MALDI |
|
|---|
| ChTry MALDI |
|
|---|
| ArgC MALDI |
|
|---|
| LysN MALDI |
|
|---|
| TryLysC MALDI |
|
|---|
| Try LTQ |
|
|---|
| ChTry LTQ |
|
|---|
| ArgC LTQ |
|
|---|
| LysN LTQ |
|
|---|
| TryLysC LTQ |
|
|---|
| Try MSlow |
|
|---|
| ChTry MSlow |
|
|---|
| ArgC MSlow |
|
|---|
| LysN MSlow |
|
|---|
| TryLysC MSlow |
|
|---|
| Try MShigh |
|
|---|
| ChTry MShigh |
|
|---|
| ArgC MShigh |
|
|---|
| LysN MShigh |
|
|---|
| TryLysC MShigh |
|
|---|
General Statistics
Number of major isoforms |
Number of additional isoforms |
Number of all proteins |
Number of amino acids |
Min. Seq. Length |
Max. Seq. Length |
Avg. Seq. Length |
Avg. Mol. Weight |
|---|---|---|---|---|---|---|---|
0 |
11236 |
60 |
730 |
255.4 |
27.85 |
Amino acid frequency
Ala |
Cys |
Asp |
Glu |
Phe |
Gly |
His |
Ile |
Lys |
Leu |
|---|---|---|---|---|---|---|---|---|---|
11.579 ± 0.708 | 0.881 ± 0.122 |
5.66 ± 0.342 | 5.411 ± 0.393 |
2.91 ± 0.191 | 8.143 ± 0.384 |
1.744 ± 0.248 | 4.486 ± 0.253 |
5.571 ± 0.388 | 7.912 ± 0.434 |
Met |
Asn |
Gln |
Pro |
Arg |
Ser |
Thr |
Val |
Trp |
Tyr |
|---|---|---|---|---|---|---|---|---|---|
3.106 ± 0.183 | 3.818 ± 0.32 |
5.028 ± 0.194 | 4.735 ± 0.41 |
5.278 ± 0.324 | 5.028 ± 0.24 |
6.942 ± 0.564 | 7.316 ± 0.278 |
1.397 ± 0.124 | 3.053 ± 0.255 |
Most of the basic statistics you can see at this page can be downloaded from this CSV file
See this proteome in:

Proteome-pI is available under Creative Commons Attribution-NoDerivs license, for more details see here
| Reference: Kozlowski LP. Proteome-pI 2.0: Proteome Isoelectric Point Database Update. Nucleic Acids Res. 2021, doi: 10.1093/nar/gkab944 | Contact: Lukasz P. Kozlowski |