Afipia broomeae
Taxonomy: cellular organisms; Bacteria; Proteobacteria; Alphaproteobacteria; Hyphomicrobiales; Bradyrhizobiaceae;
Average proteome isoelectric point is 6.87
Get precalculated fractions of proteins

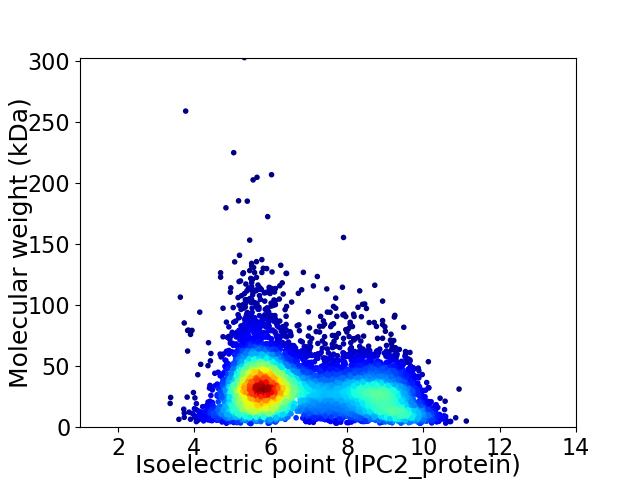
Virtual 2D-PAGE plot for 7389 proteins (isoelectric point calculated using IPC2_protein)
Get csv file with sequences according to given criteria:
* You can choose from 21 different methods for calculating isoelectric point
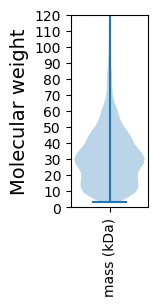
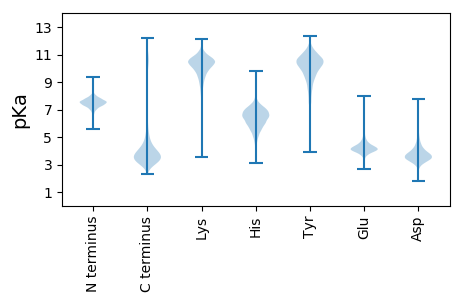
Summary statistics related to proteome-wise predictions


Protein with the lowest isoelectric point:
>tr|A0A2M8ZKW5|A0A2M8ZKW5_9BRAD Glutamate/tyrosine decarboxylase-like PLP-dependent enzyme OS=Afipia broomeae OX=56946 GN=BKA77_2963 PE=3 SV=1
MM1 pKa = 7.81GIFDD5 pKa = 4.95ALNTAVGGLQSQSFALQNISGNIANASTVGYY36 pKa = 9.86KK37 pKa = 10.31GVNTTFEE44 pKa = 4.57DD45 pKa = 4.75LIADD49 pKa = 4.22ASSPSGQVAGGVAAYY64 pKa = 9.12AQQTITTAGTVSASTVATNMAINGDD89 pKa = 4.06GFFSVQNATGTVDD102 pKa = 3.58GQPVFSGVTDD112 pKa = 3.31YY113 pKa = 11.22TRR115 pKa = 11.84AGDD118 pKa = 3.8FQVNANGYY126 pKa = 8.24LVNGAGYY133 pKa = 9.66YY134 pKa = 10.88LMGVTVDD141 pKa = 4.09PKK143 pKa = 10.31TGNPLGSVPQVLQFQNNFVPAQATSALQYY172 pKa = 10.7AANLPTKK179 pKa = 9.78PATTASTTAPAGSVTAAGGLSPGDD203 pKa = 3.58FGQNPMILGTPATPFGNSSVTGSPAASTAGPISTGTLLSSKK244 pKa = 10.63AVGSTSGTAVDD255 pKa = 4.79DD256 pKa = 3.99QTTSPVPITGTTLLAGGPGTASLTNAFANGDD287 pKa = 4.16TITVGTKK294 pKa = 9.75TITFSTTAATSTDD307 pKa = 3.33ANGGVINLGTGTVNDD322 pKa = 3.51VLKK325 pKa = 11.03AIDD328 pKa = 4.69EE329 pKa = 4.31ISTTGTASTVSGGKK343 pKa = 8.0ITLNDD348 pKa = 3.39SAGDD352 pKa = 3.52ITVTSSNTAAFTALGFSGGTVTTTAGTATGTLVNNQTTTPVPVSGTTLLSGVAGAYY408 pKa = 9.99SLSSGFAANDD418 pKa = 3.96TITVNGKK425 pKa = 8.17TITFSTTAATSTSASGGVINLGTGTVQDD453 pKa = 3.8VLTAIDD459 pKa = 4.85EE460 pKa = 4.49ISGTTTPSTISASGVITLNDD480 pKa = 3.38NAGSLSITSSNSSALGALGFSASTITTPSALSASFSAGDD519 pKa = 3.64TVTVDD524 pKa = 3.07GKK526 pKa = 9.37TISFYY531 pKa = 11.3DD532 pKa = 3.71PTSTTGPTSAGSATNTTYY550 pKa = 11.49LNLATATVGTLLTTIDD566 pKa = 4.18SLTGASVHH574 pKa = 6.27ASISATGAITLNTGTAADD592 pKa = 4.49LSVSSTNTSAFGALGFTDD610 pKa = 4.17PMTAARR616 pKa = 11.84TGGGTAGTGVVIGNDD631 pKa = 2.9LTAFTNEE638 pKa = 4.49SISGGAVTAYY648 pKa = 10.47NSAGTPVNLQVRR660 pKa = 11.84WALTSTAGGQDD671 pKa = 3.53TWNMFYY677 pKa = 9.38QTDD680 pKa = 3.59TSATGSQVAWVNAGTNFVFNANGSLSSPSGSAITIPGVTVNNQSLGNLTLNVGEE734 pKa = 4.63GALTQYY740 pKa = 11.64ASTSGSATVNTFTQNGYY757 pKa = 10.11AAGQLQSVAINNNGLVVGTFSNGQDD782 pKa = 3.69LDD784 pKa = 4.06LASITLSHH792 pKa = 7.23FNGTNYY798 pKa = 10.22LQALSGEE805 pKa = 4.55AYY807 pKa = 10.29AVTAQSGPAIAGASGTISGSSLEE830 pKa = 4.39GSNTDD835 pKa = 3.49IADD838 pKa = 3.88EE839 pKa = 4.17FTKK842 pKa = 11.09LIVTQQAYY850 pKa = 9.83SANTKK855 pKa = 10.44VITTANDD862 pKa = 3.71MIQSLLSVLRR872 pKa = 4.12
MM1 pKa = 7.81GIFDD5 pKa = 4.95ALNTAVGGLQSQSFALQNISGNIANASTVGYY36 pKa = 9.86KK37 pKa = 10.31GVNTTFEE44 pKa = 4.57DD45 pKa = 4.75LIADD49 pKa = 4.22ASSPSGQVAGGVAAYY64 pKa = 9.12AQQTITTAGTVSASTVATNMAINGDD89 pKa = 4.06GFFSVQNATGTVDD102 pKa = 3.58GQPVFSGVTDD112 pKa = 3.31YY113 pKa = 11.22TRR115 pKa = 11.84AGDD118 pKa = 3.8FQVNANGYY126 pKa = 8.24LVNGAGYY133 pKa = 9.66YY134 pKa = 10.88LMGVTVDD141 pKa = 4.09PKK143 pKa = 10.31TGNPLGSVPQVLQFQNNFVPAQATSALQYY172 pKa = 10.7AANLPTKK179 pKa = 9.78PATTASTTAPAGSVTAAGGLSPGDD203 pKa = 3.58FGQNPMILGTPATPFGNSSVTGSPAASTAGPISTGTLLSSKK244 pKa = 10.63AVGSTSGTAVDD255 pKa = 4.79DD256 pKa = 3.99QTTSPVPITGTTLLAGGPGTASLTNAFANGDD287 pKa = 4.16TITVGTKK294 pKa = 9.75TITFSTTAATSTDD307 pKa = 3.33ANGGVINLGTGTVNDD322 pKa = 3.51VLKK325 pKa = 11.03AIDD328 pKa = 4.69EE329 pKa = 4.31ISTTGTASTVSGGKK343 pKa = 8.0ITLNDD348 pKa = 3.39SAGDD352 pKa = 3.52ITVTSSNTAAFTALGFSGGTVTTTAGTATGTLVNNQTTTPVPVSGTTLLSGVAGAYY408 pKa = 9.99SLSSGFAANDD418 pKa = 3.96TITVNGKK425 pKa = 8.17TITFSTTAATSTSASGGVINLGTGTVQDD453 pKa = 3.8VLTAIDD459 pKa = 4.85EE460 pKa = 4.49ISGTTTPSTISASGVITLNDD480 pKa = 3.38NAGSLSITSSNSSALGALGFSASTITTPSALSASFSAGDD519 pKa = 3.64TVTVDD524 pKa = 3.07GKK526 pKa = 9.37TISFYY531 pKa = 11.3DD532 pKa = 3.71PTSTTGPTSAGSATNTTYY550 pKa = 11.49LNLATATVGTLLTTIDD566 pKa = 4.18SLTGASVHH574 pKa = 6.27ASISATGAITLNTGTAADD592 pKa = 4.49LSVSSTNTSAFGALGFTDD610 pKa = 4.17PMTAARR616 pKa = 11.84TGGGTAGTGVVIGNDD631 pKa = 2.9LTAFTNEE638 pKa = 4.49SISGGAVTAYY648 pKa = 10.47NSAGTPVNLQVRR660 pKa = 11.84WALTSTAGGQDD671 pKa = 3.53TWNMFYY677 pKa = 9.38QTDD680 pKa = 3.59TSATGSQVAWVNAGTNFVFNANGSLSSPSGSAITIPGVTVNNQSLGNLTLNVGEE734 pKa = 4.63GALTQYY740 pKa = 11.64ASTSGSATVNTFTQNGYY757 pKa = 10.11AAGQLQSVAINNNGLVVGTFSNGQDD782 pKa = 3.69LDD784 pKa = 4.06LASITLSHH792 pKa = 7.23FNGTNYY798 pKa = 10.22LQALSGEE805 pKa = 4.55AYY807 pKa = 10.29AVTAQSGPAIAGASGTISGSSLEE830 pKa = 4.39GSNTDD835 pKa = 3.49IADD838 pKa = 3.88EE839 pKa = 4.17FTKK842 pKa = 11.09LIVTQQAYY850 pKa = 9.83SANTKK855 pKa = 10.44VITTANDD862 pKa = 3.71MIQSLLSVLRR872 pKa = 4.12
Molecular weight: 85.47 kDa
Isoelectric point according different methods:
Protein with the highest isoelectric point:
>tr|A0A2M8ZP66|A0A2M8ZP66_9BRAD DNA-binding transcriptional LysR family regulator OS=Afipia broomeae OX=56946 GN=BKA77_4155 PE=3 SV=1
MM1 pKa = 7.65KK2 pKa = 10.25VRR4 pKa = 11.84NSLKK8 pKa = 10.15SLRR11 pKa = 11.84GRR13 pKa = 11.84HH14 pKa = 5.06RR15 pKa = 11.84NNRR18 pKa = 11.84LVRR21 pKa = 11.84RR22 pKa = 11.84KK23 pKa = 10.2GRR25 pKa = 11.84VYY27 pKa = 10.74VINKK31 pKa = 4.67VQRR34 pKa = 11.84RR35 pKa = 11.84FKK37 pKa = 10.83ARR39 pKa = 11.84QGG41 pKa = 3.34
MM1 pKa = 7.65KK2 pKa = 10.25VRR4 pKa = 11.84NSLKK8 pKa = 10.15SLRR11 pKa = 11.84GRR13 pKa = 11.84HH14 pKa = 5.06RR15 pKa = 11.84NNRR18 pKa = 11.84LVRR21 pKa = 11.84RR22 pKa = 11.84KK23 pKa = 10.2GRR25 pKa = 11.84VYY27 pKa = 10.74VINKK31 pKa = 4.67VQRR34 pKa = 11.84RR35 pKa = 11.84FKK37 pKa = 10.83ARR39 pKa = 11.84QGG41 pKa = 3.34
Molecular weight: 5.03 kDa
Isoelectric point according different methods:
Peptides (in silico digests for buttom-up proteomics)
Below you can find in silico digests of the whole proteome with Trypsin, Chymotrypsin, Trypsin+LysC, LysN, ArgC proteases suitable for different mass spec machines.| Try ESI |
 |
|---|
| ChTry ESI |
 |
|---|
| ArgC ESI |
 |
|---|
| LysN ESI |
 |
|---|
| TryLysC ESI |
 |
|---|
| Try MALDI |
 |
|---|
| ChTry MALDI |
 |
|---|
| ArgC MALDI |
 |
|---|
| LysN MALDI |
 |
|---|
| TryLysC MALDI |
 |
|---|
| Try LTQ |
 |
|---|
| ChTry LTQ |
 |
|---|
| ArgC LTQ |
 |
|---|
| LysN LTQ |
 |
|---|
| TryLysC LTQ |
 |
|---|
| Try MSlow |
 |
|---|
| ChTry MSlow |
 |
|---|
| ArgC MSlow |
 |
|---|
| LysN MSlow |
 |
|---|
| TryLysC MSlow |
 |
|---|
| Try MShigh |
 |
|---|
| ChTry MShigh |
 |
|---|
| ArgC MShigh |
 |
|---|
| LysN MShigh |
 |
|---|
| TryLysC MShigh |
 |
|---|
General Statistics
Number of major isoforms |
Number of additional isoforms |
Number of all proteins |
Number of amino acids |
Min. Seq. Length |
Max. Seq. Length |
Avg. Seq. Length |
Avg. Mol. Weight |
|---|---|---|---|---|---|---|---|
0 |
2250058 |
29 |
2793 |
304.5 |
33.07 |
Amino acid frequency
Ala |
Cys |
Asp |
Glu |
Phe |
Gly |
His |
Ile |
Lys |
Leu |
|---|---|---|---|---|---|---|---|---|---|
12.017 ± 0.038 | 0.884 ± 0.009 |
5.49 ± 0.021 | 5.135 ± 0.025 |
3.913 ± 0.017 | 8.314 ± 0.026 |
2.048 ± 0.015 | 5.599 ± 0.02 |
3.709 ± 0.026 | 9.89 ± 0.034 |
Met |
Asn |
Gln |
Pro |
Arg |
Ser |
Thr |
Val |
Trp |
Tyr |
|---|---|---|---|---|---|---|---|---|---|
2.488 ± 0.012 | 2.885 ± 0.019 |
5.251 ± 0.023 | 3.179 ± 0.016 |
6.704 ± 0.03 | 5.926 ± 0.024 |
5.412 ± 0.023 | 7.481 ± 0.023 |
1.335 ± 0.011 | 2.342 ± 0.013 |
Most of the basic statistics you can see at this page can be downloaded from this CSV file
Proteome-pI is available under Creative Commons Attribution-NoDerivs license, for more details see here
| Reference: Kozlowski LP. Proteome-pI 2.0: Proteome Isoelectric Point Database Update. Nucleic Acids Res. 2021, doi: 10.1093/nar/gkab944 | Contact: Lukasz P. Kozlowski |
