Ustilago trichophora
Taxonomy: cellular organisms; Eukaryota; Opisthokonta; Fungi; Dikarya; Basidiomycota; Ustilaginomycotina; Ustilaginomycetes; Ustilaginales; Ustilaginaceae; Ustilago
Average proteome isoelectric point is 6.79
Get precalculated fractions of proteins

Virtual 2D-PAGE plot for 13002 proteins (isoelectric point calculated using IPC2_protein)
Get csv file with sequences according to given criteria:
* You can choose from 21 different methods for calculating isoelectric point
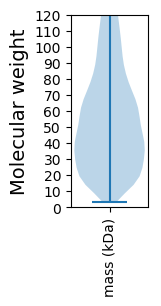
Summary statistics related to proteome-wise predictions


Protein with the lowest isoelectric point:
>tr|A0A5C3DYT7|A0A5C3DYT7_9BASI Related to LST8 - required for transport of permeases from the golgi to the plasma membrane OS=Ustilago trichophora OX=86804 GN=UTRI_03848_B PE=3 SV=1
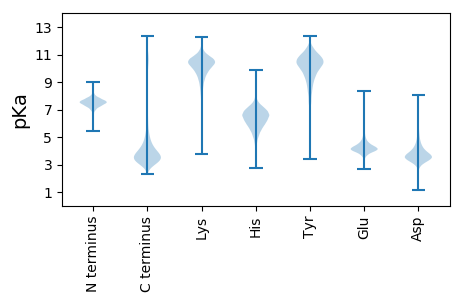
MM1 pKa = 6.93YY2 pKa = 9.56QACVNFDD9 pKa = 4.43SINCDD14 pKa = 3.06QHH16 pKa = 8.18DD17 pKa = 4.15VASAASVPILPSSNWLVDD35 pKa = 3.52AANEE39 pKa = 4.01LHH41 pKa = 6.87SEE43 pKa = 4.27YY44 pKa = 10.34PPEE47 pKa = 4.6TPHH50 pKa = 5.42QTNNAPMEE58 pKa = 4.56PCEE61 pKa = 4.38HH62 pKa = 7.19LDD64 pKa = 3.75LFDD67 pKa = 4.53SASVDD72 pKa = 5.11DD73 pKa = 5.92NDD75 pKa = 6.3DD76 pKa = 5.0DD77 pKa = 7.12DD78 pKa = 7.36DD79 pKa = 7.34DD80 pKa = 6.93DD81 pKa = 6.67DD82 pKa = 4.75EE83 pKa = 6.9SEE85 pKa = 6.36LLACWDD91 pKa = 3.84SQDD94 pKa = 4.59EE95 pKa = 4.41YY96 pKa = 11.34NDD98 pKa = 3.43NDD100 pKa = 4.07GATTPVQFGVEE111 pKa = 4.21HH112 pKa = 6.42QDD114 pKa = 2.96EE115 pKa = 4.63SQTFEE120 pKa = 3.79EE121 pKa = 4.42QQRR124 pKa = 11.84IQQPMPASSQSAEE137 pKa = 3.8IVSSNTDD144 pKa = 2.88EE145 pKa = 4.7TIPRR149 pKa = 11.84TRR151 pKa = 11.84RR152 pKa = 11.84RR153 pKa = 11.84CMAEE157 pKa = 3.41IARR160 pKa = 11.84TLAIHH165 pKa = 6.42MGMASIAFGLGCLSTTVRR183 pKa = 11.84TAAPNPSQTFSVDD196 pKa = 3.14KK197 pKa = 10.84LLQLALNHH205 pKa = 6.57LAA207 pKa = 4.66
MM1 pKa = 6.93YY2 pKa = 9.56QACVNFDD9 pKa = 4.43SINCDD14 pKa = 3.06QHH16 pKa = 8.18DD17 pKa = 4.15VASAASVPILPSSNWLVDD35 pKa = 3.52AANEE39 pKa = 4.01LHH41 pKa = 6.87SEE43 pKa = 4.27YY44 pKa = 10.34PPEE47 pKa = 4.6TPHH50 pKa = 5.42QTNNAPMEE58 pKa = 4.56PCEE61 pKa = 4.38HH62 pKa = 7.19LDD64 pKa = 3.75LFDD67 pKa = 4.53SASVDD72 pKa = 5.11DD73 pKa = 5.92NDD75 pKa = 6.3DD76 pKa = 5.0DD77 pKa = 7.12DD78 pKa = 7.36DD79 pKa = 7.34DD80 pKa = 6.93DD81 pKa = 6.67DD82 pKa = 4.75EE83 pKa = 6.9SEE85 pKa = 6.36LLACWDD91 pKa = 3.84SQDD94 pKa = 4.59EE95 pKa = 4.41YY96 pKa = 11.34NDD98 pKa = 3.43NDD100 pKa = 4.07GATTPVQFGVEE111 pKa = 4.21HH112 pKa = 6.42QDD114 pKa = 2.96EE115 pKa = 4.63SQTFEE120 pKa = 3.79EE121 pKa = 4.42QQRR124 pKa = 11.84IQQPMPASSQSAEE137 pKa = 3.8IVSSNTDD144 pKa = 2.88EE145 pKa = 4.7TIPRR149 pKa = 11.84TRR151 pKa = 11.84RR152 pKa = 11.84RR153 pKa = 11.84CMAEE157 pKa = 3.41IARR160 pKa = 11.84TLAIHH165 pKa = 6.42MGMASIAFGLGCLSTTVRR183 pKa = 11.84TAAPNPSQTFSVDD196 pKa = 3.14KK197 pKa = 10.84LLQLALNHH205 pKa = 6.57LAA207 pKa = 4.66
Molecular weight: 22.79 kDa
Isoelectric point according different methods:
Protein with the highest isoelectric point:
>tr|A0A5C3EBZ5|A0A5C3EBZ5_9BASI alpha-1 2-Mannosidase OS=Ustilago trichophora OX=86804 GN=UTRI_04591_B PE=3 SV=1
MM1 pKa = 7.1RR2 pKa = 11.84AKK4 pKa = 9.12WRR6 pKa = 11.84KK7 pKa = 8.88KK8 pKa = 8.94RR9 pKa = 11.84MRR11 pKa = 11.84RR12 pKa = 11.84LRR14 pKa = 11.84RR15 pKa = 11.84KK16 pKa = 8.14RR17 pKa = 11.84RR18 pKa = 11.84KK19 pKa = 8.51MRR21 pKa = 11.84ARR23 pKa = 11.84SKK25 pKa = 11.11
MM1 pKa = 7.1RR2 pKa = 11.84AKK4 pKa = 9.12WRR6 pKa = 11.84KK7 pKa = 8.88KK8 pKa = 8.94RR9 pKa = 11.84MRR11 pKa = 11.84RR12 pKa = 11.84LRR14 pKa = 11.84RR15 pKa = 11.84KK16 pKa = 8.14RR17 pKa = 11.84RR18 pKa = 11.84KK19 pKa = 8.51MRR21 pKa = 11.84ARR23 pKa = 11.84SKK25 pKa = 11.11
Molecular weight: 3.43 kDa
Isoelectric point according different methods:
Peptides (in silico digests for buttom-up proteomics)
Below you can find in silico digests of the whole proteome with Trypsin, Chymotrypsin, Trypsin+LysC, LysN, ArgC proteases suitable for different mass spec machines.| Try ESI |
 |
|---|
| ChTry ESI |
 |
|---|
| ArgC ESI |
 |
|---|
| LysN ESI |
 |
|---|
| TryLysC ESI |
 |
|---|
| Try MALDI |
 |
|---|
| ChTry MALDI |
 |
|---|
| ArgC MALDI |
 |
|---|
| LysN MALDI |
 |
|---|
| TryLysC MALDI |
 |
|---|
| Try LTQ |
 |
|---|
| ChTry LTQ |
 |
|---|
| ArgC LTQ |
 |
|---|
| LysN LTQ |
 |
|---|
| TryLysC LTQ |
 |
|---|
| Try MSlow |
 |
|---|
| ChTry MSlow |
 |
|---|
| ArgC MSlow |
 |
|---|
| LysN MSlow |
 |
|---|
| TryLysC MSlow |
 |
|---|
| Try MShigh |
 |
|---|
| ChTry MShigh |
 |
|---|
| ArgC MShigh |
 |
|---|
| LysN MShigh |
 |
|---|
| TryLysC MShigh |
 |
|---|
General Statistics
Number of major isoforms |
Number of additional isoforms |
Number of all proteins |
Number of amino acids |
Min. Seq. Length |
Max. Seq. Length |
Avg. Seq. Length |
Avg. Mol. Weight |
|---|---|---|---|---|---|---|---|
0 |
7812304 |
25 |
4858 |
600.9 |
65.45 |
Amino acid frequency
Ala |
Cys |
Asp |
Glu |
Phe |
Gly |
His |
Ile |
Lys |
Leu |
|---|---|---|---|---|---|---|---|---|---|
10.266 ± 0.027 | 0.963 ± 0.007 |
5.692 ± 0.014 | 5.71 ± 0.019 |
3.251 ± 0.012 | 6.816 ± 0.024 |
2.494 ± 0.011 | 4.135 ± 0.014 |
4.634 ± 0.019 | 8.744 ± 0.024 |
Met |
Asn |
Gln |
Pro |
Arg |
Ser |
Thr |
Val |
Trp |
Tyr |
|---|---|---|---|---|---|---|---|---|---|
1.929 ± 0.007 | 3.427 ± 0.012 |
6.23 ± 0.019 | 4.345 ± 0.019 |
6.259 ± 0.017 | 10.042 ± 0.034 |
6.013 ± 0.013 | 5.641 ± 0.016 |
1.176 ± 0.007 | 2.233 ± 0.011 |
Most of the basic statistics you can see at this page can be downloaded from this CSV file
Proteome-pI is available under Creative Commons Attribution-NoDerivs license, for more details see here
| Reference: Kozlowski LP. Proteome-pI 2.0: Proteome Isoelectric Point Database Update. Nucleic Acids Res. 2021, doi: 10.1093/nar/gkab944 | Contact: Lukasz P. Kozlowski |
