Leifsonia rubra CMS 76R
Taxonomy: cellular organisms; Bacteria; Terrabacteria group; Actinobacteria; Actinomycetia; Micrococcales; Microbacteriaceae; Leifsonia; Leifsonia rubra
Average proteome isoelectric point is 6.09
Get precalculated fractions of proteins

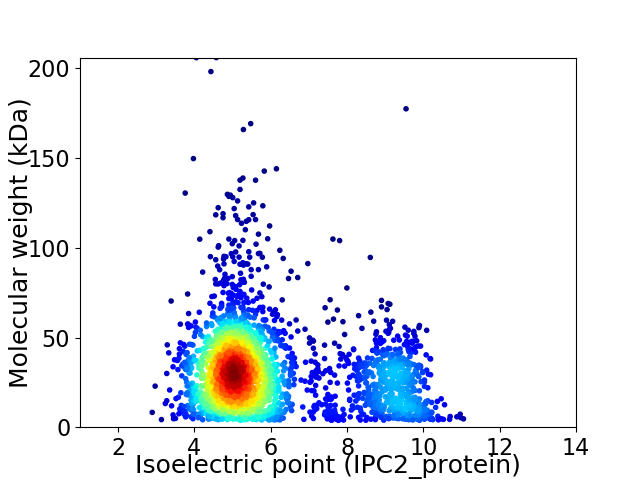
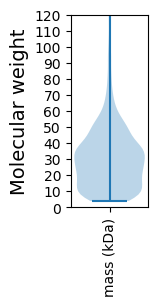
Virtual 2D-PAGE plot for 2670 proteins (isoelectric point calculated using IPC2_protein)
Get csv file with sequences according to given criteria:
* You can choose from 21 different methods for calculating isoelectric point
Summary statistics related to proteome-wise predictions


Protein with the lowest isoelectric point:
>tr|S7XEY2|S7XEY2_9MICO Integral membrane protein OS=Leifsonia rubra CMS 76R OX=1348338 GN=ADILRU_0026 PE=4 SV=1
MM1 pKa = 7.61ISHH4 pKa = 7.69HH5 pKa = 5.69YY6 pKa = 9.62RR7 pKa = 11.84RR8 pKa = 11.84AIVPIAVLGIAGMVLSGCATSTGGTGDD35 pKa = 3.11TSGPGDD41 pKa = 3.77AGEE44 pKa = 4.5ADD46 pKa = 4.64GIVTIYY52 pKa = 9.5GTISDD57 pKa = 4.34TEE59 pKa = 4.2AEE61 pKa = 4.19LLEE64 pKa = 4.37EE65 pKa = 5.22SWAEE69 pKa = 3.79WEE71 pKa = 4.35TEE73 pKa = 3.51NDD75 pKa = 2.7IDD77 pKa = 4.35IQYY80 pKa = 8.53EE81 pKa = 3.79ASKK84 pKa = 10.59EE85 pKa = 3.86FEE87 pKa = 4.06AQVSIRR93 pKa = 11.84AQGGNAPDD101 pKa = 4.05LAIFPQPGLLADD113 pKa = 4.51LASRR117 pKa = 11.84DD118 pKa = 4.11YY119 pKa = 10.79IQPAPEE125 pKa = 3.95GVASNVEE132 pKa = 4.75EE133 pKa = 4.3YY134 pKa = 10.25WSDD137 pKa = 2.94DD138 pKa = 2.83WAAYY142 pKa = 10.32ASTGDD147 pKa = 3.8TLYY150 pKa = 10.87GAPLMASVKK159 pKa = 10.16GFVWYY164 pKa = 10.49SPSQFAEE171 pKa = 3.94WGVDD175 pKa = 4.26VPTTWDD181 pKa = 3.08EE182 pKa = 4.12MLTLTEE188 pKa = 5.05TIASTTGSAPWCVGFGSDD206 pKa = 5.73AATGWPGTDD215 pKa = 3.24WIEE218 pKa = 4.3DD219 pKa = 3.61LVLRR223 pKa = 11.84EE224 pKa = 4.88AGPEE228 pKa = 4.18VYY230 pKa = 10.08DD231 pKa = 2.99QWVSHH236 pKa = 7.07EE237 pKa = 4.63IPFTDD242 pKa = 4.24PAIKK246 pKa = 10.33SAFDD250 pKa = 3.46SVGEE254 pKa = 3.83ILLNPEE260 pKa = 3.81YY261 pKa = 11.21VNAGFGGVEE270 pKa = 4.71SINTTPFGDD279 pKa = 3.69PARR282 pKa = 11.84ALGDD286 pKa = 3.74GTCALHH292 pKa = 6.19HH293 pKa = 5.88QASFYY298 pKa = 11.17DD299 pKa = 5.1GFIQDD304 pKa = 4.55PKK306 pKa = 10.92NGNATVGPDD315 pKa = 2.95ADD317 pKa = 2.71IWAFVTPSIEE327 pKa = 4.03AGGNAVTGGGEE338 pKa = 3.86IVGAFSNDD346 pKa = 2.91EE347 pKa = 3.84DD348 pKa = 4.31TIAVQEE354 pKa = 4.19YY355 pKa = 10.23LSSAEE360 pKa = 3.92WANSRR365 pKa = 11.84VSLGGVISANNGLDD379 pKa = 3.56PTSASSPILQEE390 pKa = 5.12AITILQDD397 pKa = 3.06PSTTFRR403 pKa = 11.84FDD405 pKa = 4.43ASDD408 pKa = 3.64LMPGVVGAGAFWTGMVDD425 pKa = 3.84WINGKK430 pKa = 8.31STDD433 pKa = 4.4DD434 pKa = 3.5VLSTIDD440 pKa = 3.86ASWPSEE446 pKa = 3.75
MM1 pKa = 7.61ISHH4 pKa = 7.69HH5 pKa = 5.69YY6 pKa = 9.62RR7 pKa = 11.84RR8 pKa = 11.84AIVPIAVLGIAGMVLSGCATSTGGTGDD35 pKa = 3.11TSGPGDD41 pKa = 3.77AGEE44 pKa = 4.5ADD46 pKa = 4.64GIVTIYY52 pKa = 9.5GTISDD57 pKa = 4.34TEE59 pKa = 4.2AEE61 pKa = 4.19LLEE64 pKa = 4.37EE65 pKa = 5.22SWAEE69 pKa = 3.79WEE71 pKa = 4.35TEE73 pKa = 3.51NDD75 pKa = 2.7IDD77 pKa = 4.35IQYY80 pKa = 8.53EE81 pKa = 3.79ASKK84 pKa = 10.59EE85 pKa = 3.86FEE87 pKa = 4.06AQVSIRR93 pKa = 11.84AQGGNAPDD101 pKa = 4.05LAIFPQPGLLADD113 pKa = 4.51LASRR117 pKa = 11.84DD118 pKa = 4.11YY119 pKa = 10.79IQPAPEE125 pKa = 3.95GVASNVEE132 pKa = 4.75EE133 pKa = 4.3YY134 pKa = 10.25WSDD137 pKa = 2.94DD138 pKa = 2.83WAAYY142 pKa = 10.32ASTGDD147 pKa = 3.8TLYY150 pKa = 10.87GAPLMASVKK159 pKa = 10.16GFVWYY164 pKa = 10.49SPSQFAEE171 pKa = 3.94WGVDD175 pKa = 4.26VPTTWDD181 pKa = 3.08EE182 pKa = 4.12MLTLTEE188 pKa = 5.05TIASTTGSAPWCVGFGSDD206 pKa = 5.73AATGWPGTDD215 pKa = 3.24WIEE218 pKa = 4.3DD219 pKa = 3.61LVLRR223 pKa = 11.84EE224 pKa = 4.88AGPEE228 pKa = 4.18VYY230 pKa = 10.08DD231 pKa = 2.99QWVSHH236 pKa = 7.07EE237 pKa = 4.63IPFTDD242 pKa = 4.24PAIKK246 pKa = 10.33SAFDD250 pKa = 3.46SVGEE254 pKa = 3.83ILLNPEE260 pKa = 3.81YY261 pKa = 11.21VNAGFGGVEE270 pKa = 4.71SINTTPFGDD279 pKa = 3.69PARR282 pKa = 11.84ALGDD286 pKa = 3.74GTCALHH292 pKa = 6.19HH293 pKa = 5.88QASFYY298 pKa = 11.17DD299 pKa = 5.1GFIQDD304 pKa = 4.55PKK306 pKa = 10.92NGNATVGPDD315 pKa = 2.95ADD317 pKa = 2.71IWAFVTPSIEE327 pKa = 4.03AGGNAVTGGGEE338 pKa = 3.86IVGAFSNDD346 pKa = 2.91EE347 pKa = 3.84DD348 pKa = 4.31TIAVQEE354 pKa = 4.19YY355 pKa = 10.23LSSAEE360 pKa = 3.92WANSRR365 pKa = 11.84VSLGGVISANNGLDD379 pKa = 3.56PTSASSPILQEE390 pKa = 5.12AITILQDD397 pKa = 3.06PSTTFRR403 pKa = 11.84FDD405 pKa = 4.43ASDD408 pKa = 3.64LMPGVVGAGAFWTGMVDD425 pKa = 3.84WINGKK430 pKa = 8.31STDD433 pKa = 4.4DD434 pKa = 3.5VLSTIDD440 pKa = 3.86ASWPSEE446 pKa = 3.75
Molecular weight: 47.03 kDa
Isoelectric point according different methods:
Protein with the highest isoelectric point:
>tr|S7VXX8|S7VXX8_9MICO Transcriptional regulator LacI family OS=Leifsonia rubra CMS 76R OX=1348338 GN=ADILRU_2495 PE=4 SV=1
MM1 pKa = 7.65KK2 pKa = 10.33VRR4 pKa = 11.84NSLKK8 pKa = 10.26ALKK11 pKa = 9.44KK12 pKa = 10.27IPGAQIVRR20 pKa = 11.84RR21 pKa = 11.84RR22 pKa = 11.84GRR24 pKa = 11.84TFVINKK30 pKa = 9.03KK31 pKa = 8.56NPRR34 pKa = 11.84MKK36 pKa = 10.47ARR38 pKa = 11.84QGG40 pKa = 3.24
MM1 pKa = 7.65KK2 pKa = 10.33VRR4 pKa = 11.84NSLKK8 pKa = 10.26ALKK11 pKa = 9.44KK12 pKa = 10.27IPGAQIVRR20 pKa = 11.84RR21 pKa = 11.84RR22 pKa = 11.84GRR24 pKa = 11.84TFVINKK30 pKa = 9.03KK31 pKa = 8.56NPRR34 pKa = 11.84MKK36 pKa = 10.47ARR38 pKa = 11.84QGG40 pKa = 3.24
Molecular weight: 4.65 kDa
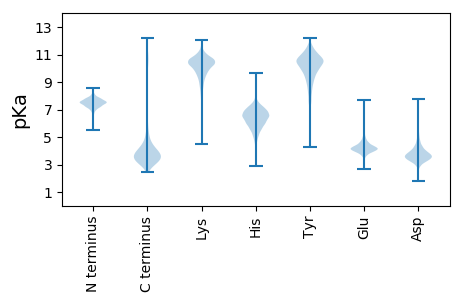
Isoelectric point according different methods:
Peptides (in silico digests for buttom-up proteomics)
Below you can find in silico digests of the whole proteome with Trypsin, Chymotrypsin, Trypsin+LysC, LysN, ArgC proteases suitable for different mass spec machines.| Try ESI |
 |
|---|
| ChTry ESI |
 |
|---|
| ArgC ESI |
 |
|---|
| LysN ESI |
 |
|---|
| TryLysC ESI |
 |
|---|
| Try MALDI |
 |
|---|
| ChTry MALDI |
 |
|---|
| ArgC MALDI |
 |
|---|
| LysN MALDI |
 |
|---|
| TryLysC MALDI |
 |
|---|
| Try LTQ |
 |
|---|
| ChTry LTQ |
 |
|---|
| ArgC LTQ |
 |
|---|
| LysN LTQ |
 |
|---|
| TryLysC LTQ |
 |
|---|
| Try MSlow |
 |
|---|
| ChTry MSlow |
 |
|---|
| ArgC MSlow |
 |
|---|
| LysN MSlow |
 |
|---|
| TryLysC MSlow |
 |
|---|
| Try MShigh |
 |
|---|
| ChTry MShigh |
 |
|---|
| ArgC MShigh |
 |
|---|
| LysN MShigh |
 |
|---|
| TryLysC MShigh |
 |
|---|
General Statistics
Number of major isoforms |
Number of additional isoforms |
Number of all proteins |
Number of amino acids |
Min. Seq. Length |
Max. Seq. Length |
Avg. Seq. Length |
Avg. Mol. Weight |
|---|---|---|---|---|---|---|---|
0 |
799840 |
37 |
2128 |
299.6 |
32.2 |
Amino acid frequency
Ala |
Cys |
Asp |
Glu |
Phe |
Gly |
His |
Ile |
Lys |
Leu |
|---|---|---|---|---|---|---|---|---|---|
12.356 ± 0.068 | 0.503 ± 0.01 |
5.841 ± 0.044 | 5.779 ± 0.047 |
3.348 ± 0.027 | 8.35 ± 0.043 |
2.001 ± 0.025 | 5.367 ± 0.036 |
2.53 ± 0.038 | 10.164 ± 0.055 |
Met |
Asn |
Gln |
Pro |
Arg |
Ser |
Thr |
Val |
Trp |
Tyr |
|---|---|---|---|---|---|---|---|---|---|
1.935 ± 0.02 | 2.617 ± 0.028 |
4.873 ± 0.033 | 2.977 ± 0.023 |
6.5 ± 0.047 | 6.553 ± 0.043 |
6.24 ± 0.045 | 8.656 ± 0.046 |
1.371 ± 0.022 | 2.038 ± 0.023 |
Most of the basic statistics you can see at this page can be downloaded from this CSV file
Proteome-pI is available under Creative Commons Attribution-NoDerivs license, for more details see here
| Reference: Kozlowski LP. Proteome-pI 2.0: Proteome Isoelectric Point Database Update. Nucleic Acids Res. 2021, doi: 10.1093/nar/gkab944 | Contact: Lukasz P. Kozlowski |
