Bluegill hepatitis B virus
Taxonomy: Viruses; Riboviria; Pararnavirae; Artverviricota; Revtraviricetes; Blubervirales; Hepadnaviridae; Metahepadnavirus
Average proteome isoelectric point is 9.0
Get precalculated fractions of proteins

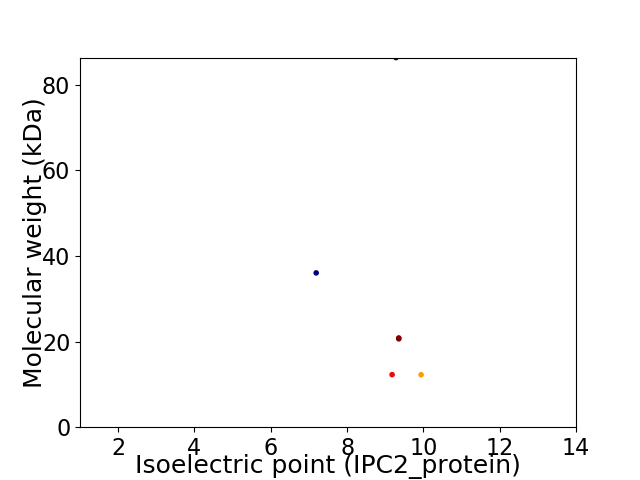
Virtual 2D-PAGE plot for 6 proteins (isoelectric point calculated using IPC2_protein)
Get csv file with sequences according to given criteria:
* You can choose from 21 different methods for calculating isoelectric point
Summary statistics related to proteome-wise predictions


Protein with the lowest isoelectric point:
>tr|A0A193AUV0|A0A193AUV0_9HEPA Core OS=Bluegill hepatitis B virus OX=2169918 PE=4 SV=1
MM1 pKa = 7.66GGAQSDD7 pKa = 4.2PVADD11 pKa = 3.64AVNILLATEE20 pKa = 4.22KK21 pKa = 11.08NKK23 pKa = 9.11TLPSAARR30 pKa = 11.84IDD32 pKa = 3.85IANTPQAKK40 pKa = 9.64RR41 pKa = 11.84LAEE44 pKa = 4.21LARR47 pKa = 11.84QHH49 pKa = 5.44QQNLQPPIQAPPPPKK64 pKa = 9.53PPPIAIPPLATDD76 pKa = 4.38AAPGPVLTRR85 pKa = 11.84RR86 pKa = 11.84TNDD89 pKa = 2.96RR90 pKa = 11.84KK91 pKa = 9.41KK92 pKa = 8.34TPVYY96 pKa = 10.33HH97 pKa = 5.58VTTAPTAAATAATPTSPPQMTGFFSGWEE125 pKa = 3.77LGFPLVLQVVFFLWTKK141 pKa = 7.88IHH143 pKa = 6.51EE144 pKa = 4.95IIGKK148 pKa = 9.48LDD150 pKa = 3.32SWWIFLSSPEE160 pKa = 4.42CLTGSGGLGLHH171 pKa = 6.07PQISPHH177 pKa = 6.7LPTNCQPGCPGYY189 pKa = 9.83PWTCLRR195 pKa = 11.84RR196 pKa = 11.84FIIFLCILALFVILSLVYY214 pKa = 10.52LDD216 pKa = 4.01WIGMLFCCCCNGSDD230 pKa = 4.79CTNCTCSGSNGKK242 pKa = 8.91CCCVCKK248 pKa = 10.77DD249 pKa = 4.57CANCDD254 pKa = 3.28QCSWAFVKK262 pKa = 10.62HH263 pKa = 5.51LWALASAHH271 pKa = 5.97FSWLSSLEE279 pKa = 4.11SLSSISAHH287 pKa = 4.96SFKK290 pKa = 11.05VSVVLLIWMMWWWGITLTSIWQVSFMLFTTYY321 pKa = 10.95YY322 pKa = 9.54FLWGSTT328 pKa = 3.39
MM1 pKa = 7.66GGAQSDD7 pKa = 4.2PVADD11 pKa = 3.64AVNILLATEE20 pKa = 4.22KK21 pKa = 11.08NKK23 pKa = 9.11TLPSAARR30 pKa = 11.84IDD32 pKa = 3.85IANTPQAKK40 pKa = 9.64RR41 pKa = 11.84LAEE44 pKa = 4.21LARR47 pKa = 11.84QHH49 pKa = 5.44QQNLQPPIQAPPPPKK64 pKa = 9.53PPPIAIPPLATDD76 pKa = 4.38AAPGPVLTRR85 pKa = 11.84RR86 pKa = 11.84TNDD89 pKa = 2.96RR90 pKa = 11.84KK91 pKa = 9.41KK92 pKa = 8.34TPVYY96 pKa = 10.33HH97 pKa = 5.58VTTAPTAAATAATPTSPPQMTGFFSGWEE125 pKa = 3.77LGFPLVLQVVFFLWTKK141 pKa = 7.88IHH143 pKa = 6.51EE144 pKa = 4.95IIGKK148 pKa = 9.48LDD150 pKa = 3.32SWWIFLSSPEE160 pKa = 4.42CLTGSGGLGLHH171 pKa = 6.07PQISPHH177 pKa = 6.7LPTNCQPGCPGYY189 pKa = 9.83PWTCLRR195 pKa = 11.84RR196 pKa = 11.84FIIFLCILALFVILSLVYY214 pKa = 10.52LDD216 pKa = 4.01WIGMLFCCCCNGSDD230 pKa = 4.79CTNCTCSGSNGKK242 pKa = 8.91CCCVCKK248 pKa = 10.77DD249 pKa = 4.57CANCDD254 pKa = 3.28QCSWAFVKK262 pKa = 10.62HH263 pKa = 5.51LWALASAHH271 pKa = 5.97FSWLSSLEE279 pKa = 4.11SLSSISAHH287 pKa = 4.96SFKK290 pKa = 11.05VSVVLLIWMMWWWGITLTSIWQVSFMLFTTYY321 pKa = 10.95YY322 pKa = 9.54FLWGSTT328 pKa = 3.39
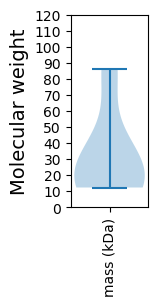
Molecular weight: 36.04 kDa
Isoelectric point according different methods:
Protein with the highest isoelectric point:
>tr|A0A193AU86|A0A193AU86_9HEPA Core OS=Bluegill hepatitis B virus OX=2169918 PE=4 SV=1
MM1 pKa = 7.32KK2 pKa = 10.47CIFSFLAQCQFGMVPKK18 pKa = 10.43NFYY21 pKa = 10.86HH22 pKa = 6.62FGFWHH27 pKa = 6.21GAKK30 pKa = 10.17PLGTTPTAFLNRR42 pKa = 11.84YY43 pKa = 8.63ISHH46 pKa = 7.33ALLAACQHH54 pKa = 5.33ARR56 pKa = 11.84YY57 pKa = 8.69LARR60 pKa = 11.84CQLYY64 pKa = 9.93KK65 pKa = 10.55SVSRR69 pKa = 11.84EE70 pKa = 3.48ISSFWHH76 pKa = 6.07SANSSGLGRR85 pKa = 11.84GPIFRR90 pKa = 11.84SLRR93 pKa = 11.84SRR95 pKa = 11.84EE96 pKa = 3.86PKK98 pKa = 10.42GRR100 pKa = 11.84GIEE103 pKa = 3.78ARR105 pKa = 11.84ARR107 pKa = 11.84VV108 pKa = 3.49
MM1 pKa = 7.32KK2 pKa = 10.47CIFSFLAQCQFGMVPKK18 pKa = 10.43NFYY21 pKa = 10.86HH22 pKa = 6.62FGFWHH27 pKa = 6.21GAKK30 pKa = 10.17PLGTTPTAFLNRR42 pKa = 11.84YY43 pKa = 8.63ISHH46 pKa = 7.33ALLAACQHH54 pKa = 5.33ARR56 pKa = 11.84YY57 pKa = 8.69LARR60 pKa = 11.84CQLYY64 pKa = 9.93KK65 pKa = 10.55SVSRR69 pKa = 11.84EE70 pKa = 3.48ISSFWHH76 pKa = 6.07SANSSGLGRR85 pKa = 11.84GPIFRR90 pKa = 11.84SLRR93 pKa = 11.84SRR95 pKa = 11.84EE96 pKa = 3.86PKK98 pKa = 10.42GRR100 pKa = 11.84GIEE103 pKa = 3.78ARR105 pKa = 11.84ARR107 pKa = 11.84VV108 pKa = 3.49
Molecular weight: 12.25 kDa
Isoelectric point according different methods:
Peptides (in silico digests for buttom-up proteomics)
Below you can find in silico digests of the whole proteome with Trypsin, Chymotrypsin, Trypsin+LysC, LysN, ArgC proteases suitable for different mass spec machines.| Try ESI |
 |
|---|
| ChTry ESI |
 |
|---|
| ArgC ESI |
 |
|---|
| LysN ESI |
 |
|---|
| TryLysC ESI |
 |
|---|
| Try MALDI |
 |
|---|
| ChTry MALDI |
 |
|---|
| ArgC MALDI |
 |
|---|
| LysN MALDI |
 |
|---|
| TryLysC MALDI |
 |
|---|
| Try LTQ |
 |
|---|
| ChTry LTQ |
 |
|---|
| ArgC LTQ |
 |
|---|
| LysN LTQ |
 |
|---|
| TryLysC LTQ |
 |
|---|
| Try MSlow |
 |
|---|
| ChTry MSlow |
 |
|---|
| ArgC MSlow |
 |
|---|
| LysN MSlow |
 |
|---|
| TryLysC MSlow |
 |
|---|
| Try MShigh |
 |
|---|
| ChTry MShigh |
 |
|---|
| ArgC MShigh |
 |
|---|
| LysN MShigh |
 |
|---|
| TryLysC MShigh |
 |
|---|
General Statistics
Number of major isoforms |
Number of additional isoforms |
Number of all proteins |
Number of amino acids |
Min. Seq. Length |
Max. Seq. Length |
Avg. Seq. Length |
Avg. Mol. Weight |
|---|---|---|---|---|---|---|---|
0 |
1674 |
105 |
769 |
279.0 |
31.4 |
Amino acid frequency
Ala |
Cys |
Asp |
Glu |
Phe |
Gly |
His |
Ile |
Lys |
Leu |
|---|---|---|---|---|---|---|---|---|---|
7.049 ± 0.55 | 2.33 ± 1.067 |
3.763 ± 0.517 | 2.389 ± 0.16 |
5.137 ± 0.629 | 6.272 ± 0.248 |
4.421 ± 0.886 | 5.615 ± 0.309 |
4.301 ± 0.22 | 10.932 ± 0.807 |
Met |
Asn |
Gln |
Pro |
Arg |
Ser |
Thr |
Val |
Trp |
Tyr |
|---|---|---|---|---|---|---|---|---|---|
1.912 ± 0.135 | 3.166 ± 0.142 |
6.93 ± 0.667 | 4.421 ± 0.329 |
6.332 ± 1.161 | 8.363 ± 0.168 |
6.153 ± 0.527 | 5.376 ± 0.959 |
2.509 ± 0.632 | 2.628 ± 0.394 |
Most of the basic statistics you can see at this page can be downloaded from this CSV file
Proteome-pI is available under Creative Commons Attribution-NoDerivs license, for more details see here
| Reference: Kozlowski LP. Proteome-pI 2.0: Proteome Isoelectric Point Database Update. Nucleic Acids Res. 2021, doi: 10.1093/nar/gkab944 | Contact: Lukasz P. Kozlowski |
