Baja California bark scorpion polyomavirus 1
Taxonomy: Viruses; Monodnaviria; Shotokuvirae; Cossaviricota; Papovaviricetes; Sepolyvirales; Polyomaviridae; unclassified Polyomaviridae
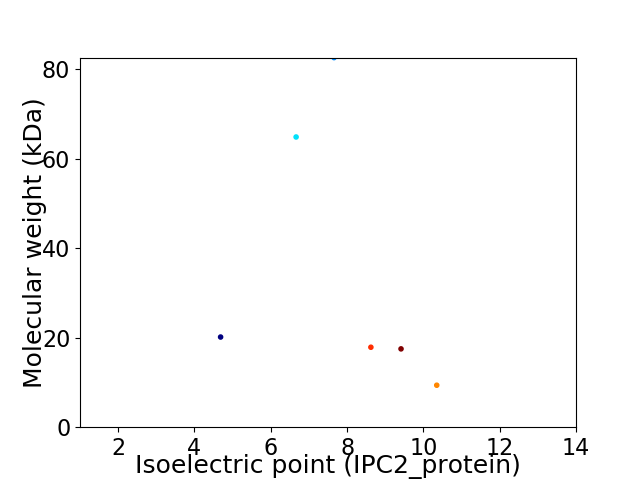
Average proteome isoelectric point is 7.62
Get precalculated fractions of proteins

Virtual 2D-PAGE plot for 6 proteins (isoelectric point calculated using IPC2_protein)
Get csv file with sequences according to given criteria:
* You can choose from 21 different methods for calculating isoelectric point
Summary statistics related to proteome-wise predictions


Protein with the lowest isoelectric point:
>tr|A0A161K1S9|A0A161K1S9_9POLY VP1e OS=Baja California bark scorpion polyomavirus 1 OX=1648839 PE=4 SV=1
MM1 pKa = 7.35GGVVSTVGAVVLFLIEE17 pKa = 4.1EE18 pKa = 4.19FAEE21 pKa = 4.29TGAIAGSAAAVGAGEE36 pKa = 4.59LSVEE40 pKa = 4.32SAAAGALGDD49 pKa = 5.0AIALAAEE56 pKa = 4.07EE57 pKa = 4.61EE58 pKa = 4.4IVIFEE63 pKa = 4.29STSAAVSGGTYY74 pKa = 10.19GSLYY78 pKa = 10.41SGSALTSGLDD88 pKa = 3.62LLADD92 pKa = 3.74TAIGEE97 pKa = 4.52SASAAALDD105 pKa = 3.95SEE107 pKa = 4.55NALGAFFANQSINIGAATSVSVGSAIGLTAWIVANGYY144 pKa = 10.16DD145 pKa = 3.7YY146 pKa = 11.53SLEE149 pKa = 4.11QVDD152 pKa = 4.62KK153 pKa = 10.95LVPTIDD159 pKa = 3.52QVGSGLFMNLYY170 pKa = 9.52FRR172 pKa = 11.84KK173 pKa = 9.81KK174 pKa = 9.41KK175 pKa = 9.95KK176 pKa = 9.52KK177 pKa = 8.24RR178 pKa = 11.84HH179 pKa = 5.66AGSEE183 pKa = 3.84EE184 pKa = 3.8GMLPKK189 pKa = 10.33LYY191 pKa = 10.06KK192 pKa = 9.77RR193 pKa = 11.84KK194 pKa = 9.84KK195 pKa = 7.28VQSYY199 pKa = 10.0
MM1 pKa = 7.35GGVVSTVGAVVLFLIEE17 pKa = 4.1EE18 pKa = 4.19FAEE21 pKa = 4.29TGAIAGSAAAVGAGEE36 pKa = 4.59LSVEE40 pKa = 4.32SAAAGALGDD49 pKa = 5.0AIALAAEE56 pKa = 4.07EE57 pKa = 4.61EE58 pKa = 4.4IVIFEE63 pKa = 4.29STSAAVSGGTYY74 pKa = 10.19GSLYY78 pKa = 10.41SGSALTSGLDD88 pKa = 3.62LLADD92 pKa = 3.74TAIGEE97 pKa = 4.52SASAAALDD105 pKa = 3.95SEE107 pKa = 4.55NALGAFFANQSINIGAATSVSVGSAIGLTAWIVANGYY144 pKa = 10.16DD145 pKa = 3.7YY146 pKa = 11.53SLEE149 pKa = 4.11QVDD152 pKa = 4.62KK153 pKa = 10.95LVPTIDD159 pKa = 3.52QVGSGLFMNLYY170 pKa = 9.52FRR172 pKa = 11.84KK173 pKa = 9.81KK174 pKa = 9.41KK175 pKa = 9.95KK176 pKa = 9.52KK177 pKa = 8.24RR178 pKa = 11.84HH179 pKa = 5.66AGSEE183 pKa = 3.84EE184 pKa = 3.8GMLPKK189 pKa = 10.33LYY191 pKa = 10.06KK192 pKa = 9.77RR193 pKa = 11.84KK194 pKa = 9.84KK195 pKa = 7.28VQSYY199 pKa = 10.0
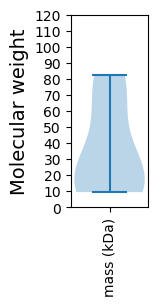
Molecular weight: 20.14 kDa
Isoelectric point according different methods:
Protein with the highest isoelectric point:
>tr|A0A160ST56|A0A160ST56_9POLY VP1 OS=Baja California bark scorpion polyomavirus 1 OX=1648839 PE=4 SV=1
MM1 pKa = 7.42SALLIQRR8 pKa = 11.84SWPGYY13 pKa = 6.21TEE15 pKa = 4.53KK16 pKa = 11.0NADD19 pKa = 3.02NFIRR23 pKa = 11.84TRR25 pKa = 11.84AVPKK29 pKa = 10.28KK30 pKa = 9.48KK31 pKa = 9.81PNYY34 pKa = 9.87SIPLSPNIKK43 pKa = 10.0NLNRR47 pKa = 11.84TQDD50 pKa = 3.18AAFSAKK56 pKa = 9.57KK57 pKa = 10.67SLMTGSNLRR66 pKa = 11.84VRR68 pKa = 11.84LRR70 pKa = 11.84LKK72 pKa = 10.52KK73 pKa = 9.69ILKK76 pKa = 9.6FRR78 pKa = 11.84IFII81 pKa = 4.35
MM1 pKa = 7.42SALLIQRR8 pKa = 11.84SWPGYY13 pKa = 6.21TEE15 pKa = 4.53KK16 pKa = 11.0NADD19 pKa = 3.02NFIRR23 pKa = 11.84TRR25 pKa = 11.84AVPKK29 pKa = 10.28KK30 pKa = 9.48KK31 pKa = 9.81PNYY34 pKa = 9.87SIPLSPNIKK43 pKa = 10.0NLNRR47 pKa = 11.84TQDD50 pKa = 3.18AAFSAKK56 pKa = 9.57KK57 pKa = 10.67SLMTGSNLRR66 pKa = 11.84VRR68 pKa = 11.84LRR70 pKa = 11.84LKK72 pKa = 10.52KK73 pKa = 9.69ILKK76 pKa = 9.6FRR78 pKa = 11.84IFII81 pKa = 4.35
Molecular weight: 9.38 kDa
Isoelectric point according different methods:
Peptides (in silico digests for buttom-up proteomics)
Below you can find in silico digests of the whole proteome with Trypsin, Chymotrypsin, Trypsin+LysC, LysN, ArgC proteases suitable for different mass spec machines.| Try ESI |
 |
|---|
| ChTry ESI |
 |
|---|
| ArgC ESI |
 |
|---|
| LysN ESI |
 |
|---|
| TryLysC ESI |
 |
|---|
| Try MALDI |
 |
|---|
| ChTry MALDI |
 |
|---|
| ArgC MALDI |
 |
|---|
| LysN MALDI |
 |
|---|
| TryLysC MALDI |
 |
|---|
| Try LTQ |
 |
|---|
| ChTry LTQ |
 |
|---|
| ArgC LTQ |
 |
|---|
| LysN LTQ |
 |
|---|
| TryLysC LTQ |
 |
|---|
| Try MSlow |
 |
|---|
| ChTry MSlow |
 |
|---|
| ArgC MSlow |
 |
|---|
| LysN MSlow |
 |
|---|
| TryLysC MSlow |
 |
|---|
| Try MShigh |
 |
|---|
| ChTry MShigh |
 |
|---|
| ArgC MShigh |
 |
|---|
| LysN MShigh |
 |
|---|
| TryLysC MShigh |
 |
|---|
General Statistics
Number of major isoforms |
Number of additional isoforms |
Number of all proteins |
Number of amino acids |
Min. Seq. Length |
Max. Seq. Length |
Avg. Seq. Length |
Avg. Mol. Weight |
|---|---|---|---|---|---|---|---|
0 |
1862 |
81 |
725 |
310.3 |
35.38 |
Amino acid frequency
Ala |
Cys |
Asp |
Glu |
Phe |
Gly |
His |
Ile |
Lys |
Leu |
|---|---|---|---|---|---|---|---|---|---|
6.337 ± 1.671 | 3.222 ± 0.803 |
5.156 ± 1.003 | 5.854 ± 0.661 |
4.78 ± 0.69 | 5.263 ± 1.234 |
2.256 ± 0.614 | 6.606 ± 0.556 |
8.324 ± 0.808 | 7.68 ± 0.998 |
Met |
Asn |
Gln |
Pro |
Arg |
Ser |
Thr |
Val |
Trp |
Tyr |
|---|---|---|---|---|---|---|---|---|---|
2.417 ± 0.239 | 6.23 ± 0.818 |
4.834 ± 1.054 | 3.008 ± 0.499 |
5.424 ± 0.803 | 6.767 ± 1.169 |
5.263 ± 0.737 | 5.371 ± 0.579 |
1.343 ± 0.465 | 3.867 ± 0.272 |
Most of the basic statistics you can see at this page can be downloaded from this CSV file
Proteome-pI is available under Creative Commons Attribution-NoDerivs license, for more details see here
| Reference: Kozlowski LP. Proteome-pI 2.0: Proteome Isoelectric Point Database Update. Nucleic Acids Res. 2021, doi: 10.1093/nar/gkab944 | Contact: Lukasz P. Kozlowski |
