Mycobacterium phage Zeuska
Taxonomy: Viruses; Duplodnaviria; Heunggongvirae; Uroviricota; Caudoviricetes; Caudovirales; Siphoviridae; Fromanvirus; unclassified Fromanvirus
Average proteome isoelectric point is 6.21
Get precalculated fractions of proteins
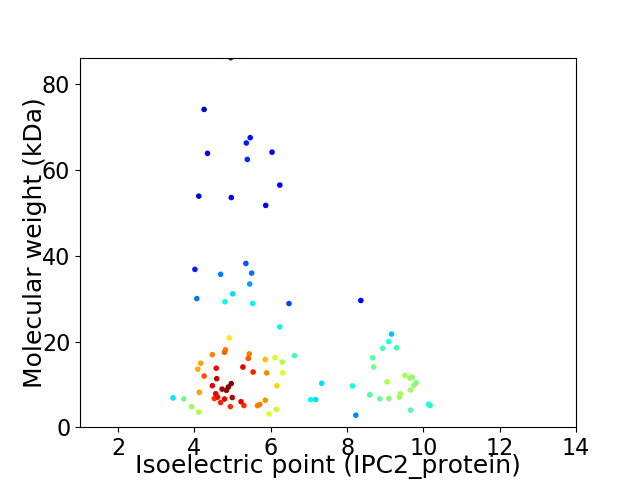
Virtual 2D-PAGE plot for 93 proteins (isoelectric point calculated using IPC2_protein)
Get csv file with sequences according to given criteria:
* You can choose from 21 different methods for calculating isoelectric point
Summary statistics related to proteome-wise predictions


Protein with the lowest isoelectric point:
>tr|A0A481VW90|A0A481VW90_9CAUD Uncharacterized protein OS=Mycobacterium phage Zeuska OX=2341047 GN=37 PE=4 SV=1
MM1 pKa = 7.61GFTLRR6 pKa = 11.84LFGIPVLSLEE16 pKa = 4.13ITGDD20 pKa = 3.64GSAEE24 pKa = 4.06EE25 pKa = 4.65YY26 pKa = 10.37ISLTGGSFEE35 pKa = 4.74LAPEE39 pKa = 3.98EE40 pKa = 4.15PEE42 pKa = 3.9YY43 pKa = 11.13DD44 pKa = 3.29EE45 pKa = 5.61EE46 pKa = 4.95YY47 pKa = 10.82YY48 pKa = 10.93EE49 pKa = 4.22EE50 pKa = 4.6DD51 pKa = 3.1RR52 pKa = 11.84SGFGFGVSS60 pKa = 3.28
MM1 pKa = 7.61GFTLRR6 pKa = 11.84LFGIPVLSLEE16 pKa = 4.13ITGDD20 pKa = 3.64GSAEE24 pKa = 4.06EE25 pKa = 4.65YY26 pKa = 10.37ISLTGGSFEE35 pKa = 4.74LAPEE39 pKa = 3.98EE40 pKa = 4.15PEE42 pKa = 3.9YY43 pKa = 11.13DD44 pKa = 3.29EE45 pKa = 5.61EE46 pKa = 4.95YY47 pKa = 10.82YY48 pKa = 10.93EE49 pKa = 4.22EE50 pKa = 4.6DD51 pKa = 3.1RR52 pKa = 11.84SGFGFGVSS60 pKa = 3.28
Molecular weight: 6.61 kDa
Isoelectric point according different methods:
Protein with the highest isoelectric point:
>tr|A0A481VV74|A0A481VV74_9CAUD Uncharacterized protein OS=Mycobacterium phage Zeuska OX=2341047 GN=52 PE=4 SV=1
MM1 pKa = 7.57SKK3 pKa = 10.43HH4 pKa = 5.9EE5 pKa = 4.16YY6 pKa = 9.67VVEE9 pKa = 4.05LGGEE13 pKa = 3.86LWVQKK18 pKa = 10.51RR19 pKa = 11.84LARR22 pKa = 11.84RR23 pKa = 11.84LGLTHH28 pKa = 6.01VRR30 pKa = 11.84EE31 pKa = 4.68SVSGRR36 pKa = 11.84HH37 pKa = 5.61RR38 pKa = 11.84LPDD41 pKa = 3.18VRR43 pKa = 11.84FSQEE47 pKa = 3.84LPGGTVYY54 pKa = 10.53WSVNRR59 pKa = 11.84KK60 pKa = 9.3GFFRR64 pKa = 11.84RR65 pKa = 11.84DD66 pKa = 3.17DD67 pKa = 3.85SLPSGWVQRR76 pKa = 11.84IYY78 pKa = 10.86PRR80 pKa = 11.84VATSFRR86 pKa = 11.84TAEE89 pKa = 3.85
MM1 pKa = 7.57SKK3 pKa = 10.43HH4 pKa = 5.9EE5 pKa = 4.16YY6 pKa = 9.67VVEE9 pKa = 4.05LGGEE13 pKa = 3.86LWVQKK18 pKa = 10.51RR19 pKa = 11.84LARR22 pKa = 11.84RR23 pKa = 11.84LGLTHH28 pKa = 6.01VRR30 pKa = 11.84EE31 pKa = 4.68SVSGRR36 pKa = 11.84HH37 pKa = 5.61RR38 pKa = 11.84LPDD41 pKa = 3.18VRR43 pKa = 11.84FSQEE47 pKa = 3.84LPGGTVYY54 pKa = 10.53WSVNRR59 pKa = 11.84KK60 pKa = 9.3GFFRR64 pKa = 11.84RR65 pKa = 11.84DD66 pKa = 3.17DD67 pKa = 3.85SLPSGWVQRR76 pKa = 11.84IYY78 pKa = 10.86PRR80 pKa = 11.84VATSFRR86 pKa = 11.84TAEE89 pKa = 3.85
Molecular weight: 10.4 kDa
Isoelectric point according different methods:
Peptides (in silico digests for buttom-up proteomics)
Below you can find in silico digests of the whole proteome with Trypsin, Chymotrypsin, Trypsin+LysC, LysN, ArgC proteases suitable for different mass spec machines.| Try ESI |
 |
|---|
| ChTry ESI |
|
|---|
| ArgC ESI |
|
|---|
| LysN ESI |
|
|---|
| TryLysC ESI |
|
|---|
| Try MALDI |
|
|---|
| ChTry MALDI |
|
|---|
| ArgC MALDI |
|
|---|
| LysN MALDI |
|
|---|
| TryLysC MALDI |
|
|---|
| Try LTQ |
|
|---|
| ChTry LTQ |
|
|---|
| ArgC LTQ |
|
|---|
| LysN LTQ |
|
|---|
| TryLysC LTQ |
|
|---|
| Try MSlow |
|
|---|
| ChTry MSlow |
|
|---|
| ArgC MSlow |
|
|---|
| LysN MSlow |
|
|---|
| TryLysC MSlow |
|
|---|
| Try MShigh |
|
|---|
| ChTry MShigh |
|
|---|
| ArgC MShigh |
|
|---|
| LysN MShigh |
|
|---|
| TryLysC MShigh |
|
|---|
General Statistics
Number of major isoforms |
Number of additional isoforms |
Number of all proteins |
Number of amino acids |
Min. Seq. Length |
Max. Seq. Length |
Avg. Seq. Length |
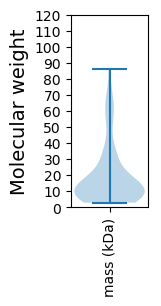
Avg. Mol. Weight |
|---|---|---|---|---|---|---|---|
0 |
16438 |
26 |
826 |
176.8 |
19.42 |
Amino acid frequency
Ala |
Cys |
Asp |
Glu |
Phe |
Gly |
His |
Ile |
Lys |
Leu |
|---|---|---|---|---|---|---|---|---|---|
9.873 ± 0.351 | 0.712 ± 0.12 |
6.455 ± 0.2 | 6.771 ± 0.247 |
3.054 ± 0.158 | 8.815 ± 0.469 |
2.02 ± 0.186 | 4.879 ± 0.228 |
4.179 ± 0.238 | 8.505 ± 0.232 |
Met |
Asn |
Gln |
Pro |
Arg |
Ser |
Thr |
Val |
Trp |
Tyr |
|---|---|---|---|---|---|---|---|---|---|
2.026 ± 0.108 | 3.267 ± 0.155 |
5.378 ± 0.213 | 3.169 ± 0.171 |
6.515 ± 0.373 | 6.035 ± 0.27 |
6.248 ± 0.264 | 7.136 ± 0.214 |
2.111 ± 0.128 | 2.853 ± 0.175 |
Most of the basic statistics you can see at this page can be downloaded from this CSV file
See this proteome in:

Proteome-pI is available under Creative Commons Attribution-NoDerivs license, for more details see here
| Reference: Kozlowski LP. Proteome-pI 2.0: Proteome Isoelectric Point Database Update. Nucleic Acids Res. 2021, doi: 10.1093/nar/gkab944 | Contact: Lukasz P. Kozlowski |