Kocuria sp. HSID16901
Taxonomy: cellular organisms; Bacteria; Terrabacteria group; Actinobacteria; Actinomycetia; Micrococcales; Micrococcaceae; Kocuria; unclassified Kocuria
Average proteome isoelectric point is 6.03
Get precalculated fractions of proteins

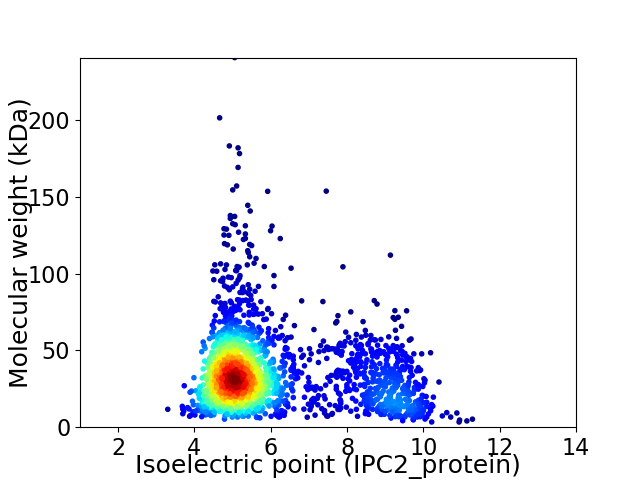
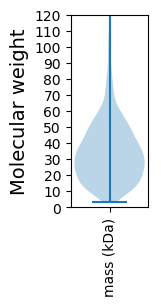
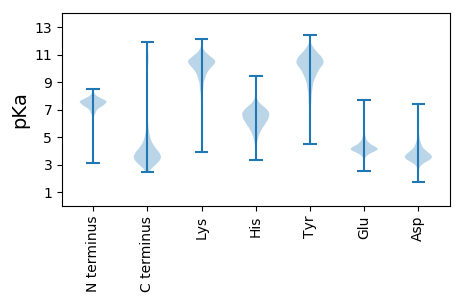
Virtual 2D-PAGE plot for 2178 proteins (isoelectric point calculated using IPC2_protein)
Get csv file with sequences according to given criteria:
* You can choose from 21 different methods for calculating isoelectric point
Summary statistics related to proteome-wise predictions


Protein with the lowest isoelectric point:
>tr|A0A433H2H6|A0A433H2H6_9MICC ATP-sulfurylase large subunit OS=Kocuria sp. HSID16901 OX=2419505 GN=D8M21_03535 PE=4 SV=1
MM1 pKa = 7.44ARR3 pKa = 11.84ALLIVDD9 pKa = 4.02VQNDD13 pKa = 3.76FCRR16 pKa = 11.84GGALATDD23 pKa = 3.98RR24 pKa = 11.84GDD26 pKa = 3.98DD27 pKa = 3.49VAAEE31 pKa = 4.15ISAYY35 pKa = 10.95LLTHH39 pKa = 6.3HH40 pKa = 7.26AAYY43 pKa = 10.31DD44 pKa = 3.94VVVTTQDD51 pKa = 2.65WHH53 pKa = 6.83IDD55 pKa = 3.48PGTHH59 pKa = 6.48FSEE62 pKa = 5.18NPDD65 pKa = 3.64FTNSWPVHH73 pKa = 5.38CVANSSGAAFHH84 pKa = 7.55PDD86 pKa = 3.07LDD88 pKa = 3.8MDD90 pKa = 4.11YY91 pKa = 10.98VDD93 pKa = 4.53AMFRR97 pKa = 11.84KK98 pKa = 10.15GEE100 pKa = 3.99YY101 pKa = 8.44EE102 pKa = 3.52AAYY105 pKa = 10.68SGFEE109 pKa = 3.94GLLAPEE115 pKa = 4.69DD116 pKa = 3.66SVMTGEE122 pKa = 4.74HH123 pKa = 6.52EE124 pKa = 4.47PGHH127 pKa = 5.75MPEE130 pKa = 4.54DD131 pKa = 3.89TLKK134 pKa = 11.09VSLDD138 pKa = 3.44DD139 pKa = 3.75WLQEE143 pKa = 3.96QDD145 pKa = 3.58VTDD148 pKa = 3.63VDD150 pKa = 4.33VVGIATDD157 pKa = 3.55YY158 pKa = 10.74CVRR161 pKa = 11.84ATALDD166 pKa = 3.89AADD169 pKa = 3.97AGYY172 pKa = 7.43EE173 pKa = 4.08TRR175 pKa = 11.84VLVDD179 pKa = 3.65LTSAVADD186 pKa = 4.13EE187 pKa = 4.32TAEE190 pKa = 4.04TAVAEE195 pKa = 4.3LEE197 pKa = 4.27DD198 pKa = 4.63AGVQVIEE205 pKa = 4.38STSVGRR211 pKa = 4.29
MM1 pKa = 7.44ARR3 pKa = 11.84ALLIVDD9 pKa = 4.02VQNDD13 pKa = 3.76FCRR16 pKa = 11.84GGALATDD23 pKa = 3.98RR24 pKa = 11.84GDD26 pKa = 3.98DD27 pKa = 3.49VAAEE31 pKa = 4.15ISAYY35 pKa = 10.95LLTHH39 pKa = 6.3HH40 pKa = 7.26AAYY43 pKa = 10.31DD44 pKa = 3.94VVVTTQDD51 pKa = 2.65WHH53 pKa = 6.83IDD55 pKa = 3.48PGTHH59 pKa = 6.48FSEE62 pKa = 5.18NPDD65 pKa = 3.64FTNSWPVHH73 pKa = 5.38CVANSSGAAFHH84 pKa = 7.55PDD86 pKa = 3.07LDD88 pKa = 3.8MDD90 pKa = 4.11YY91 pKa = 10.98VDD93 pKa = 4.53AMFRR97 pKa = 11.84KK98 pKa = 10.15GEE100 pKa = 3.99YY101 pKa = 8.44EE102 pKa = 3.52AAYY105 pKa = 10.68SGFEE109 pKa = 3.94GLLAPEE115 pKa = 4.69DD116 pKa = 3.66SVMTGEE122 pKa = 4.74HH123 pKa = 6.52EE124 pKa = 4.47PGHH127 pKa = 5.75MPEE130 pKa = 4.54DD131 pKa = 3.89TLKK134 pKa = 11.09VSLDD138 pKa = 3.44DD139 pKa = 3.75WLQEE143 pKa = 3.96QDD145 pKa = 3.58VTDD148 pKa = 3.63VDD150 pKa = 4.33VVGIATDD157 pKa = 3.55YY158 pKa = 10.74CVRR161 pKa = 11.84ATALDD166 pKa = 3.89AADD169 pKa = 3.97AGYY172 pKa = 7.43EE173 pKa = 4.08TRR175 pKa = 11.84VLVDD179 pKa = 3.65LTSAVADD186 pKa = 4.13EE187 pKa = 4.32TAEE190 pKa = 4.04TAVAEE195 pKa = 4.3LEE197 pKa = 4.27DD198 pKa = 4.63AGVQVIEE205 pKa = 4.38STSVGRR211 pKa = 4.29
Molecular weight: 22.76 kDa
Isoelectric point according different methods:
Protein with the highest isoelectric point:
>tr|A0A433GWA0|A0A433GWA0_9MICC Ribonuclease P protein component OS=Kocuria sp. HSID16901 OX=2419505 GN=rnpA PE=3 SV=1
MM1 pKa = 7.69SKK3 pKa = 9.0RR4 pKa = 11.84TFQPNNRR11 pKa = 11.84RR12 pKa = 11.84RR13 pKa = 11.84AKK15 pKa = 9.97KK16 pKa = 9.33HH17 pKa = 4.25GFRR20 pKa = 11.84LRR22 pKa = 11.84MRR24 pKa = 11.84TRR26 pKa = 11.84AGRR29 pKa = 11.84AILANRR35 pKa = 11.84RR36 pKa = 11.84AKK38 pKa = 10.48GRR40 pKa = 11.84ASVSAA45 pKa = 3.98
MM1 pKa = 7.69SKK3 pKa = 9.0RR4 pKa = 11.84TFQPNNRR11 pKa = 11.84RR12 pKa = 11.84RR13 pKa = 11.84AKK15 pKa = 9.97KK16 pKa = 9.33HH17 pKa = 4.25GFRR20 pKa = 11.84LRR22 pKa = 11.84MRR24 pKa = 11.84TRR26 pKa = 11.84AGRR29 pKa = 11.84AILANRR35 pKa = 11.84RR36 pKa = 11.84AKK38 pKa = 10.48GRR40 pKa = 11.84ASVSAA45 pKa = 3.98
Molecular weight: 5.24 kDa
Isoelectric point according different methods:
Peptides (in silico digests for buttom-up proteomics)
Below you can find in silico digests of the whole proteome with Trypsin, Chymotrypsin, Trypsin+LysC, LysN, ArgC proteases suitable for different mass spec machines.| Try ESI |
 |
|---|
| ChTry ESI |
 |
|---|
| ArgC ESI |
 |
|---|
| LysN ESI |
 |
|---|
| TryLysC ESI |
 |
|---|
| Try MALDI |
 |
|---|
| ChTry MALDI |
 |
|---|
| ArgC MALDI |
 |
|---|
| LysN MALDI |
 |
|---|
| TryLysC MALDI |
 |
|---|
| Try LTQ |
 |
|---|
| ChTry LTQ |
 |
|---|
| ArgC LTQ |
 |
|---|
| LysN LTQ |
 |
|---|
| TryLysC LTQ |
 |
|---|
| Try MSlow |
 |
|---|
| ChTry MSlow |
 |
|---|
| ArgC MSlow |
 |
|---|
| LysN MSlow |
 |
|---|
| TryLysC MSlow |
 |
|---|
| Try MShigh |
 |
|---|
| ChTry MShigh |
 |
|---|
| ArgC MShigh |
 |
|---|
| LysN MShigh |
 |
|---|
| TryLysC MShigh |
 |
|---|
General Statistics
Number of major isoforms |
Number of additional isoforms |
Number of all proteins |
Number of amino acids |
Min. Seq. Length |
Max. Seq. Length |
Avg. Seq. Length |
Avg. Mol. Weight |
|---|---|---|---|---|---|---|---|
0 |
733174 |
29 |
2179 |
336.6 |
36.5 |
Amino acid frequency
Ala |
Cys |
Asp |
Glu |
Phe |
Gly |
His |
Ile |
Lys |
Leu |
|---|---|---|---|---|---|---|---|---|---|
10.986 ± 0.057 | 0.651 ± 0.013 |
6.03 ± 0.046 | 6.43 ± 0.065 |
3.172 ± 0.035 | 8.651 ± 0.055 |
2.336 ± 0.022 | 4.767 ± 0.033 |
3.047 ± 0.04 | 9.378 ± 0.056 |
Met |
Asn |
Gln |
Pro |
Arg |
Ser |
Thr |
Val |
Trp |
Tyr |
|---|---|---|---|---|---|---|---|---|---|
2.232 ± 0.023 | 2.663 ± 0.029 |
5.098 ± 0.034 | 3.34 ± 0.029 |
6.773 ± 0.061 | 6.693 ± 0.04 |
5.953 ± 0.035 | 8.204 ± 0.037 |
1.406 ± 0.023 | 2.19 ± 0.023 |
Most of the basic statistics you can see at this page can be downloaded from this CSV file
Proteome-pI is available under Creative Commons Attribution-NoDerivs license, for more details see here
| Reference: Kozlowski LP. Proteome-pI 2.0: Proteome Isoelectric Point Database Update. Nucleic Acids Res. 2021, doi: 10.1093/nar/gkab944 | Contact: Lukasz P. Kozlowski |
