Inhangapi virus
Taxonomy: Viruses; Riboviria; Orthornavirae; Negarnaviricota; Haploviricotina; Monjiviricetes; Mononegavirales; Rhabdoviridae; Alpharhabdovirinae; Arurhavirus; Inhangapi arurhavirus
Average proteome isoelectric point is 6.59
Get precalculated fractions of proteins

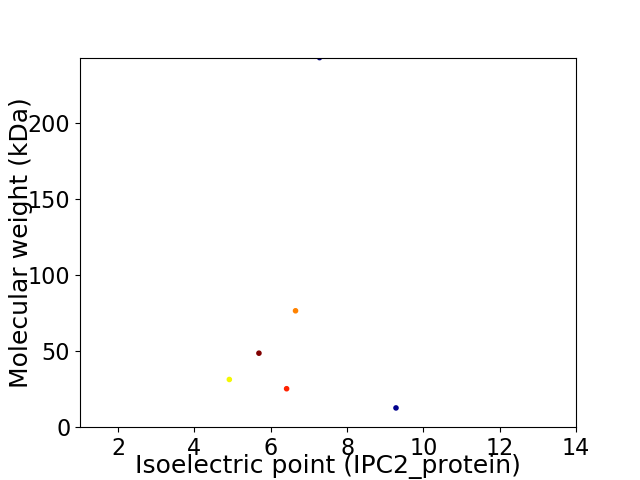
Virtual 2D-PAGE plot for 6 proteins (isoelectric point calculated using IPC2_protein)
Get csv file with sequences according to given criteria:
* You can choose from 21 different methods for calculating isoelectric point
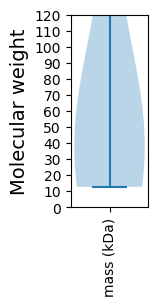
Summary statistics related to proteome-wise predictions


Protein with the lowest isoelectric point:
>tr|A0A0D3R128|A0A0D3R128_9RHAB Nucleocapsid protein OS=Inhangapi virus OX=1620892 PE=4 SV=1
MM1 pKa = 7.61EE2 pKa = 5.65KK3 pKa = 10.43FNSSNFCFPDD13 pKa = 3.26MSSTFKK19 pKa = 10.77DD20 pKa = 2.87IRR22 pKa = 11.84EE23 pKa = 3.95ISDD26 pKa = 4.69LIEE29 pKa = 5.83DD30 pKa = 5.08DD31 pKa = 5.28LPPPPPDD38 pKa = 4.23PPTFDD43 pKa = 3.06SAEE46 pKa = 4.15FPNQQLDD53 pKa = 3.2WGDD56 pKa = 3.52KK57 pKa = 7.57VTEE60 pKa = 3.91EE61 pKa = 4.15AARR64 pKa = 11.84GDD66 pKa = 3.7WEE68 pKa = 4.54LPPPAGDD75 pKa = 3.16NVFTFRR81 pKa = 11.84TSSLKK86 pKa = 10.64DD87 pKa = 3.25LEE89 pKa = 4.26RR90 pKa = 11.84AAIEE94 pKa = 4.21SEE96 pKa = 4.62LINLIAWIYY105 pKa = 10.19KK106 pKa = 8.19HH107 pKa = 5.58THH109 pKa = 5.83LLLDD113 pKa = 3.82YY114 pKa = 10.15RR115 pKa = 11.84VSDD118 pKa = 4.33DD119 pKa = 4.91GIDD122 pKa = 3.31VLTIEE127 pKa = 4.9KK128 pKa = 10.65GEE130 pKa = 4.08SLEE133 pKa = 4.15WEE135 pKa = 4.28NPKK138 pKa = 10.29PEE140 pKa = 4.16QPSPCSVNGKK150 pKa = 7.76TLDD153 pKa = 4.37DD154 pKa = 4.05ALADD158 pKa = 3.63YY159 pKa = 10.73RR160 pKa = 11.84EE161 pKa = 4.19LMKK164 pKa = 10.25IEE166 pKa = 4.68PPAKK170 pKa = 9.33PVPEE174 pKa = 4.08TSRR177 pKa = 11.84EE178 pKa = 4.08SKK180 pKa = 9.37TVNKK184 pKa = 9.85NVSYY188 pKa = 10.54QKK190 pKa = 10.92EE191 pKa = 4.29KK192 pKa = 10.32MGEE195 pKa = 4.09TEE197 pKa = 4.15GGKK200 pKa = 10.07KK201 pKa = 9.83PGSLYY206 pKa = 10.64IMFKK210 pKa = 10.38NGIRR214 pKa = 11.84FEE216 pKa = 4.09KK217 pKa = 9.76RR218 pKa = 11.84TGHH221 pKa = 5.25GTLKK225 pKa = 10.46ISLDD229 pKa = 3.68TPGITEE235 pKa = 3.83KK236 pKa = 10.96AIAEE240 pKa = 4.24GEE242 pKa = 4.09NMNLKK247 pKa = 10.68DD248 pKa = 4.07GLKK251 pKa = 10.33KK252 pKa = 10.36ALKK255 pKa = 10.26KK256 pKa = 10.61SGIYY260 pKa = 9.49KK261 pKa = 10.61ALALKK266 pKa = 10.59ADD268 pKa = 3.94INNPIWPKK276 pKa = 10.1MDD278 pKa = 3.74FF279 pKa = 3.61
MM1 pKa = 7.61EE2 pKa = 5.65KK3 pKa = 10.43FNSSNFCFPDD13 pKa = 3.26MSSTFKK19 pKa = 10.77DD20 pKa = 2.87IRR22 pKa = 11.84EE23 pKa = 3.95ISDD26 pKa = 4.69LIEE29 pKa = 5.83DD30 pKa = 5.08DD31 pKa = 5.28LPPPPPDD38 pKa = 4.23PPTFDD43 pKa = 3.06SAEE46 pKa = 4.15FPNQQLDD53 pKa = 3.2WGDD56 pKa = 3.52KK57 pKa = 7.57VTEE60 pKa = 3.91EE61 pKa = 4.15AARR64 pKa = 11.84GDD66 pKa = 3.7WEE68 pKa = 4.54LPPPAGDD75 pKa = 3.16NVFTFRR81 pKa = 11.84TSSLKK86 pKa = 10.64DD87 pKa = 3.25LEE89 pKa = 4.26RR90 pKa = 11.84AAIEE94 pKa = 4.21SEE96 pKa = 4.62LINLIAWIYY105 pKa = 10.19KK106 pKa = 8.19HH107 pKa = 5.58THH109 pKa = 5.83LLLDD113 pKa = 3.82YY114 pKa = 10.15RR115 pKa = 11.84VSDD118 pKa = 4.33DD119 pKa = 4.91GIDD122 pKa = 3.31VLTIEE127 pKa = 4.9KK128 pKa = 10.65GEE130 pKa = 4.08SLEE133 pKa = 4.15WEE135 pKa = 4.28NPKK138 pKa = 10.29PEE140 pKa = 4.16QPSPCSVNGKK150 pKa = 7.76TLDD153 pKa = 4.37DD154 pKa = 4.05ALADD158 pKa = 3.63YY159 pKa = 10.73RR160 pKa = 11.84EE161 pKa = 4.19LMKK164 pKa = 10.25IEE166 pKa = 4.68PPAKK170 pKa = 9.33PVPEE174 pKa = 4.08TSRR177 pKa = 11.84EE178 pKa = 4.08SKK180 pKa = 9.37TVNKK184 pKa = 9.85NVSYY188 pKa = 10.54QKK190 pKa = 10.92EE191 pKa = 4.29KK192 pKa = 10.32MGEE195 pKa = 4.09TEE197 pKa = 4.15GGKK200 pKa = 10.07KK201 pKa = 9.83PGSLYY206 pKa = 10.64IMFKK210 pKa = 10.38NGIRR214 pKa = 11.84FEE216 pKa = 4.09KK217 pKa = 9.76RR218 pKa = 11.84TGHH221 pKa = 5.25GTLKK225 pKa = 10.46ISLDD229 pKa = 3.68TPGITEE235 pKa = 3.83KK236 pKa = 10.96AIAEE240 pKa = 4.24GEE242 pKa = 4.09NMNLKK247 pKa = 10.68DD248 pKa = 4.07GLKK251 pKa = 10.33KK252 pKa = 10.36ALKK255 pKa = 10.26KK256 pKa = 10.61SGIYY260 pKa = 9.49KK261 pKa = 10.61ALALKK266 pKa = 10.59ADD268 pKa = 3.94INNPIWPKK276 pKa = 10.1MDD278 pKa = 3.74FF279 pKa = 3.61
Molecular weight: 31.35 kDa
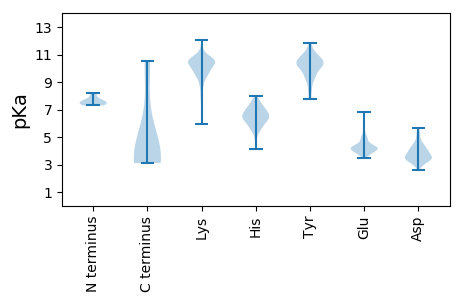
Isoelectric point according different methods:
Protein with the highest isoelectric point:
>tr|A0A0D3R1G5|A0A0D3R1G5_9RHAB G OS=Inhangapi virus OX=1620892 PE=4 SV=1
MM1 pKa = 7.6NITSRR6 pKa = 11.84INWQSVDD13 pKa = 3.23PSKK16 pKa = 10.45WFEE19 pKa = 4.24GIKK22 pKa = 10.71DD23 pKa = 3.61GANSFFSSLKK33 pKa = 10.65VVFQDD38 pKa = 2.91TKK40 pKa = 9.71YY41 pKa = 10.21WINLFFWLIVAILIMVIVLKK61 pKa = 10.31FSNYY65 pKa = 10.31LIGLINQCGACVKK78 pKa = 10.27MIGNCQCKK86 pKa = 9.83CKK88 pKa = 10.53KK89 pKa = 9.47KK90 pKa = 10.05AKK92 pKa = 9.9KK93 pKa = 9.19RR94 pKa = 11.84GKK96 pKa = 9.54IIKK99 pKa = 9.43INKK102 pKa = 8.78IYY104 pKa = 10.67NPRR107 pKa = 11.84NMM109 pKa = 4.28
MM1 pKa = 7.6NITSRR6 pKa = 11.84INWQSVDD13 pKa = 3.23PSKK16 pKa = 10.45WFEE19 pKa = 4.24GIKK22 pKa = 10.71DD23 pKa = 3.61GANSFFSSLKK33 pKa = 10.65VVFQDD38 pKa = 2.91TKK40 pKa = 9.71YY41 pKa = 10.21WINLFFWLIVAILIMVIVLKK61 pKa = 10.31FSNYY65 pKa = 10.31LIGLINQCGACVKK78 pKa = 10.27MIGNCQCKK86 pKa = 9.83CKK88 pKa = 10.53KK89 pKa = 9.47KK90 pKa = 10.05AKK92 pKa = 9.9KK93 pKa = 9.19RR94 pKa = 11.84GKK96 pKa = 9.54IIKK99 pKa = 9.43INKK102 pKa = 8.78IYY104 pKa = 10.67NPRR107 pKa = 11.84NMM109 pKa = 4.28
Molecular weight: 12.66 kDa
Isoelectric point according different methods:
Peptides (in silico digests for buttom-up proteomics)
Below you can find in silico digests of the whole proteome with Trypsin, Chymotrypsin, Trypsin+LysC, LysN, ArgC proteases suitable for different mass spec machines.| Try ESI |
 |
|---|
| ChTry ESI |
 |
|---|
| ArgC ESI |
 |
|---|
| LysN ESI |
 |
|---|
| TryLysC ESI |
 |
|---|
| Try MALDI |
 |
|---|
| ChTry MALDI |
 |
|---|
| ArgC MALDI |
 |
|---|
| LysN MALDI |
 |
|---|
| TryLysC MALDI |
 |
|---|
| Try LTQ |
 |
|---|
| ChTry LTQ |
 |
|---|
| ArgC LTQ |
 |
|---|
| LysN LTQ |
 |
|---|
| TryLysC LTQ |
 |
|---|
| Try MSlow |
 |
|---|
| ChTry MSlow |
 |
|---|
| ArgC MSlow |
 |
|---|
| LysN MSlow |
 |
|---|
| TryLysC MSlow |
 |
|---|
| Try MShigh |
 |
|---|
| ChTry MShigh |
 |
|---|
| ArgC MShigh |
 |
|---|
| LysN MShigh |
 |
|---|
| TryLysC MShigh |
 |
|---|
General Statistics
Number of major isoforms |
Number of additional isoforms |
Number of all proteins |
Number of amino acids |
Min. Seq. Length |
Max. Seq. Length |
Avg. Seq. Length |
Avg. Mol. Weight |
|---|---|---|---|---|---|---|---|
0 |
3813 |
109 |
2104 |
635.5 |
72.85 |
Amino acid frequency
Ala |
Cys |
Asp |
Glu |
Phe |
Gly |
His |
Ile |
Lys |
Leu |
|---|---|---|---|---|---|---|---|---|---|
3.436 ± 0.648 | 1.678 ± 0.318 |
5.953 ± 0.467 | 6.216 ± 0.544 |
3.855 ± 0.287 | 5.744 ± 0.138 |
2.229 ± 0.344 | 8.786 ± 0.717 |
7.815 ± 0.724 | 9.31 ± 0.605 |
Met |
Asn |
Gln |
Pro |
Arg |
Ser |
Thr |
Val |
Trp |
Tyr |
|---|---|---|---|---|---|---|---|---|---|
3.016 ± 0.245 | 5.56 ± 0.402 |
4.878 ± 0.8 | 3.173 ± 0.262 |
4.485 ± 0.371 | 7.763 ± 0.257 |
5.612 ± 0.485 | 4.721 ± 0.544 |
1.836 ± 0.207 | 3.934 ± 0.378 |
Most of the basic statistics you can see at this page can be downloaded from this CSV file
Proteome-pI is available under Creative Commons Attribution-NoDerivs license, for more details see here
| Reference: Kozlowski LP. Proteome-pI 2.0: Proteome Isoelectric Point Database Update. Nucleic Acids Res. 2021, doi: 10.1093/nar/gkab944 | Contact: Lukasz P. Kozlowski |
