Embleya scabrispora
Taxonomy: cellular organisms; Bacteria; Terrabacteria group; Actinobacteria; Actinomycetia; Streptomycetales; Streptomycetaceae; Embleya
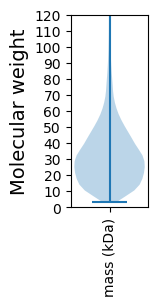
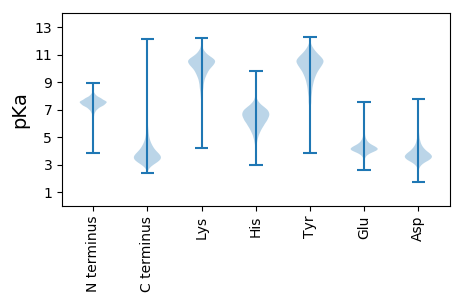
Average proteome isoelectric point is 6.47
Get precalculated fractions of proteins

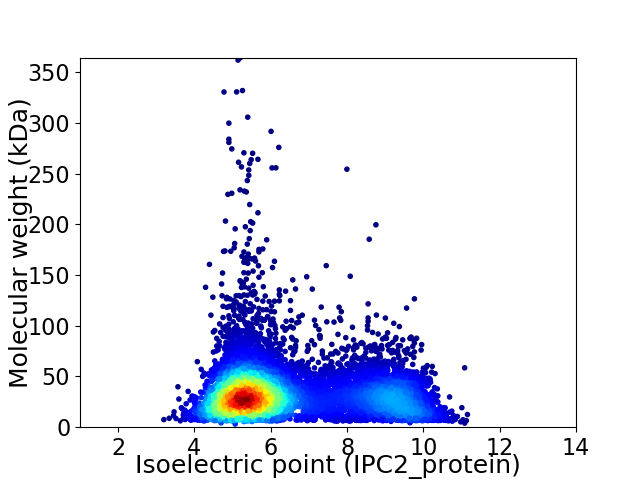
Virtual 2D-PAGE plot for 9009 proteins (isoelectric point calculated using IPC2_protein)
Get csv file with sequences according to given criteria:
* You can choose from 21 different methods for calculating isoelectric point
Summary statistics related to proteome-wise predictions


Protein with the lowest isoelectric point:
>tr|A0A1T3P4U8|A0A1T3P4U8_9ACTN Cobalamin-binding protein OS=Embleya scabrispora OX=159449 GN=B4N89_27155 PE=4 SV=1
MM1 pKa = 6.95TAWLPTAHH9 pKa = 6.82ATPPTNVPTTAADD22 pKa = 3.57YY23 pKa = 9.4GARR26 pKa = 11.84WLASRR31 pKa = 11.84FVSDD35 pKa = 3.49GNGNKK40 pKa = 10.15FIPATGSPTTPEE52 pKa = 4.41PSNTMQAALALAAAGVEE69 pKa = 4.09EE70 pKa = 4.53ATFDD74 pKa = 5.53DD75 pKa = 4.62AVDD78 pKa = 3.38WLKK81 pKa = 11.69ANVTTTIAPGGTDD94 pKa = 2.91NPGRR98 pKa = 11.84LGYY101 pKa = 10.72LLLVADD107 pKa = 4.99AAGEE111 pKa = 4.39SPTSFGGVDD120 pKa = 3.5LVTRR124 pKa = 11.84LGNLRR129 pKa = 11.84QTTGADD135 pKa = 2.77TGLFGSADD143 pKa = 3.52PTYY146 pKa = 11.04DD147 pKa = 3.0GTFRR151 pKa = 11.84QSLAILGLRR160 pKa = 11.84AVGQSVDD167 pKa = 3.52SSSTTWLLGQQCAGGSNADD186 pKa = 3.53DD187 pKa = 4.44GGWRR191 pKa = 11.84SYY193 pKa = 11.33GGSTCDD199 pKa = 5.35GDD201 pKa = 5.2DD202 pKa = 3.72ADD204 pKa = 4.54SNSTAFAIQALVSVSHH220 pKa = 5.29TTYY223 pKa = 10.55SGEE226 pKa = 4.18VGDD229 pKa = 4.49ALGWLDD235 pKa = 5.0AVQEE239 pKa = 4.19SDD241 pKa = 4.89AGFAYY246 pKa = 10.1QPAYY250 pKa = 10.51ASDD253 pKa = 4.17PNSTSLVIQAIIAGGGNPTSATWQKK278 pKa = 11.32SGGTLNPYY286 pKa = 9.65TSLLSWQIGCTANPGDD302 pKa = 3.78VGAFASPWSSGAPDD316 pKa = 4.64LLATQQSVWGAAGAPFPLNPSFTTPTPTPCIPP348 pKa = 3.59
MM1 pKa = 6.95TAWLPTAHH9 pKa = 6.82ATPPTNVPTTAADD22 pKa = 3.57YY23 pKa = 9.4GARR26 pKa = 11.84WLASRR31 pKa = 11.84FVSDD35 pKa = 3.49GNGNKK40 pKa = 10.15FIPATGSPTTPEE52 pKa = 4.41PSNTMQAALALAAAGVEE69 pKa = 4.09EE70 pKa = 4.53ATFDD74 pKa = 5.53DD75 pKa = 4.62AVDD78 pKa = 3.38WLKK81 pKa = 11.69ANVTTTIAPGGTDD94 pKa = 2.91NPGRR98 pKa = 11.84LGYY101 pKa = 10.72LLLVADD107 pKa = 4.99AAGEE111 pKa = 4.39SPTSFGGVDD120 pKa = 3.5LVTRR124 pKa = 11.84LGNLRR129 pKa = 11.84QTTGADD135 pKa = 2.77TGLFGSADD143 pKa = 3.52PTYY146 pKa = 11.04DD147 pKa = 3.0GTFRR151 pKa = 11.84QSLAILGLRR160 pKa = 11.84AVGQSVDD167 pKa = 3.52SSSTTWLLGQQCAGGSNADD186 pKa = 3.53DD187 pKa = 4.44GGWRR191 pKa = 11.84SYY193 pKa = 11.33GGSTCDD199 pKa = 5.35GDD201 pKa = 5.2DD202 pKa = 3.72ADD204 pKa = 4.54SNSTAFAIQALVSVSHH220 pKa = 5.29TTYY223 pKa = 10.55SGEE226 pKa = 4.18VGDD229 pKa = 4.49ALGWLDD235 pKa = 5.0AVQEE239 pKa = 4.19SDD241 pKa = 4.89AGFAYY246 pKa = 10.1QPAYY250 pKa = 10.51ASDD253 pKa = 4.17PNSTSLVIQAIIAGGGNPTSATWQKK278 pKa = 11.32SGGTLNPYY286 pKa = 9.65TSLLSWQIGCTANPGDD302 pKa = 3.78VGAFASPWSSGAPDD316 pKa = 4.64LLATQQSVWGAAGAPFPLNPSFTTPTPTPCIPP348 pKa = 3.59
Molecular weight: 35.34 kDa
Isoelectric point according different methods:
Protein with the highest isoelectric point:
>tr|A0A1T3NJ67|A0A1T3NJ67_9ACTN Uncharacterized protein OS=Embleya scabrispora OX=159449 GN=B4N89_45485 PE=4 SV=1
MM1 pKa = 7.97RR2 pKa = 11.84ARR4 pKa = 11.84RR5 pKa = 11.84WSIMPRR11 pKa = 11.84TAVPSRR17 pKa = 11.84WRR19 pKa = 11.84TLMPGTTNPARR30 pKa = 11.84VLGRR34 pKa = 11.84SASSVGTGGAVKK46 pKa = 10.59LMVGVPLVFSTTRR59 pKa = 11.84TGG61 pKa = 3.23
MM1 pKa = 7.97RR2 pKa = 11.84ARR4 pKa = 11.84RR5 pKa = 11.84WSIMPRR11 pKa = 11.84TAVPSRR17 pKa = 11.84WRR19 pKa = 11.84TLMPGTTNPARR30 pKa = 11.84VLGRR34 pKa = 11.84SASSVGTGGAVKK46 pKa = 10.59LMVGVPLVFSTTRR59 pKa = 11.84TGG61 pKa = 3.23
Molecular weight: 6.54 kDa
Isoelectric point according different methods:
Peptides (in silico digests for buttom-up proteomics)
Below you can find in silico digests of the whole proteome with Trypsin, Chymotrypsin, Trypsin+LysC, LysN, ArgC proteases suitable for different mass spec machines.| Try ESI |
 |
|---|
| ChTry ESI |
 |
|---|
| ArgC ESI |
 |
|---|
| LysN ESI |
 |
|---|
| TryLysC ESI |
 |
|---|
| Try MALDI |
 |
|---|
| ChTry MALDI |
 |
|---|
| ArgC MALDI |
 |
|---|
| LysN MALDI |
 |
|---|
| TryLysC MALDI |
 |
|---|
| Try LTQ |
 |
|---|
| ChTry LTQ |
 |
|---|
| ArgC LTQ |
 |
|---|
| LysN LTQ |
 |
|---|
| TryLysC LTQ |
 |
|---|
| Try MSlow |
 |
|---|
| ChTry MSlow |
 |
|---|
| ArgC MSlow |
 |
|---|
| LysN MSlow |
 |
|---|
| TryLysC MSlow |
 |
|---|
| Try MShigh |
 |
|---|
| ChTry MShigh |
 |
|---|
| ArgC MShigh |
 |
|---|
| LysN MShigh |
 |
|---|
| TryLysC MShigh |
 |
|---|
General Statistics
Number of major isoforms |
Number of additional isoforms |
Number of all proteins |
Number of amino acids |
Min. Seq. Length |
Max. Seq. Length |
Avg. Seq. Length |
Avg. Mol. Weight |
|---|---|---|---|---|---|---|---|
0 |
2957195 |
29 |
3488 |
328.2 |
35.09 |
Amino acid frequency
Ala |
Cys |
Asp |
Glu |
Phe |
Gly |
His |
Ile |
Lys |
Leu |
|---|---|---|---|---|---|---|---|---|---|
13.975 ± 0.043 | 0.823 ± 0.007 |
6.256 ± 0.02 | 5.35 ± 0.026 |
2.69 ± 0.014 | 9.502 ± 0.029 |
2.383 ± 0.016 | 3.362 ± 0.015 |
1.723 ± 0.021 | 10.066 ± 0.035 |
Met |
Asn |
Gln |
Pro |
Arg |
Ser |
Thr |
Val |
Trp |
Tyr |
|---|---|---|---|---|---|---|---|---|---|
1.724 ± 0.011 | 1.718 ± 0.014 |
6.514 ± 0.031 | 2.225 ± 0.014 |
8.697 ± 0.028 | 4.687 ± 0.019 |
6.235 ± 0.026 | 8.615 ± 0.026 |
1.516 ± 0.011 | 1.939 ± 0.011 |
Most of the basic statistics you can see at this page can be downloaded from this CSV file
Proteome-pI is available under Creative Commons Attribution-NoDerivs license, for more details see here
| Reference: Kozlowski LP. Proteome-pI 2.0: Proteome Isoelectric Point Database Update. Nucleic Acids Res. 2021, doi: 10.1093/nar/gkab944 | Contact: Lukasz P. Kozlowski |
