Helicobacter phage FrGC43A
Taxonomy: Viruses; Duplodnaviria; Heunggongvirae; Uroviricota; Caudoviricetes; Caudovirales; Podoviridae; Schmidvirus; unclassified Schmidvirus
Average proteome isoelectric point is 7.37
Get precalculated fractions of proteins

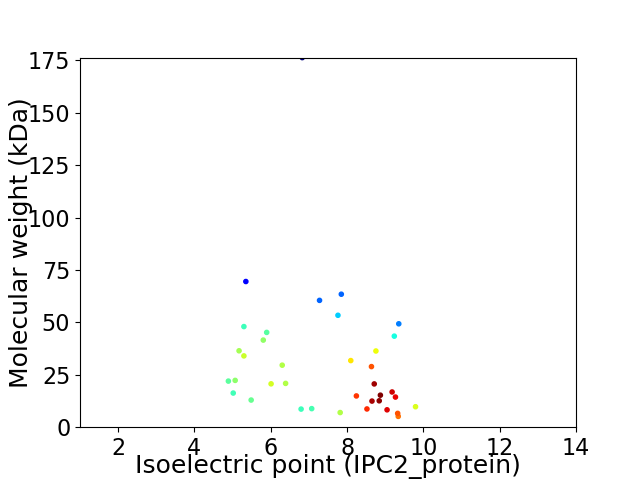
Virtual 2D-PAGE plot for 37 proteins (isoelectric point calculated using IPC2_protein)
Get csv file with sequences according to given criteria:
* You can choose from 21 different methods for calculating isoelectric point
Summary statistics related to proteome-wise predictions


Protein with the lowest isoelectric point:
>tr|A0A1S5RFZ7|A0A1S5RFZ7_9CAUD Uncharacterized protein OS=Helicobacter phage FrGC43A OX=1852666 PE=4 SV=1
MM1 pKa = 6.63MRR3 pKa = 11.84VVFFDD8 pKa = 3.34ASGVLEE14 pKa = 4.28AFDD17 pKa = 3.72YY18 pKa = 11.04RR19 pKa = 11.84GVLLHH24 pKa = 5.6TQEE27 pKa = 5.21IKK29 pKa = 11.08DD30 pKa = 3.76NLNAKK35 pKa = 10.24LPFTQKK41 pKa = 10.64NFFKK45 pKa = 10.96FNGVSFGVCEE55 pKa = 4.09GVGDD59 pKa = 4.79LDD61 pKa = 3.92YY62 pKa = 11.39RR63 pKa = 11.84DD64 pKa = 3.51YY65 pKa = 11.75SKK67 pKa = 11.41NINFNALLCEE77 pKa = 4.26TIEE80 pKa = 4.7NYY82 pKa = 10.56LLNAKK87 pKa = 9.81EE88 pKa = 4.56PEE90 pKa = 4.15NKK92 pKa = 8.56QQKK95 pKa = 10.21ALLVDD100 pKa = 4.5FLAVYY105 pKa = 9.93DD106 pKa = 3.98KK107 pKa = 11.26NIEE110 pKa = 3.81KK111 pKa = 10.37GFYY114 pKa = 9.62YY115 pKa = 10.74LEE117 pKa = 4.38PPFFKK122 pKa = 10.58EE123 pKa = 5.4KK124 pKa = 10.47EE125 pKa = 3.95IEE127 pKa = 4.06LLNMRR132 pKa = 11.84FEE134 pKa = 4.62TNDD137 pKa = 2.98RR138 pKa = 11.84SS139 pKa = 3.52
MM1 pKa = 6.63MRR3 pKa = 11.84VVFFDD8 pKa = 3.34ASGVLEE14 pKa = 4.28AFDD17 pKa = 3.72YY18 pKa = 11.04RR19 pKa = 11.84GVLLHH24 pKa = 5.6TQEE27 pKa = 5.21IKK29 pKa = 11.08DD30 pKa = 3.76NLNAKK35 pKa = 10.24LPFTQKK41 pKa = 10.64NFFKK45 pKa = 10.96FNGVSFGVCEE55 pKa = 4.09GVGDD59 pKa = 4.79LDD61 pKa = 3.92YY62 pKa = 11.39RR63 pKa = 11.84DD64 pKa = 3.51YY65 pKa = 11.75SKK67 pKa = 11.41NINFNALLCEE77 pKa = 4.26TIEE80 pKa = 4.7NYY82 pKa = 10.56LLNAKK87 pKa = 9.81EE88 pKa = 4.56PEE90 pKa = 4.15NKK92 pKa = 8.56QQKK95 pKa = 10.21ALLVDD100 pKa = 4.5FLAVYY105 pKa = 9.93DD106 pKa = 3.98KK107 pKa = 11.26NIEE110 pKa = 3.81KK111 pKa = 10.37GFYY114 pKa = 9.62YY115 pKa = 10.74LEE117 pKa = 4.38PPFFKK122 pKa = 10.58EE123 pKa = 5.4KK124 pKa = 10.47EE125 pKa = 3.95IEE127 pKa = 4.06LLNMRR132 pKa = 11.84FEE134 pKa = 4.62TNDD137 pKa = 2.98RR138 pKa = 11.84SS139 pKa = 3.52
Molecular weight: 16.29 kDa
Isoelectric point according different methods:
Protein with the highest isoelectric point:
>tr|A0A1S5RG13|A0A1S5RG13_9CAUD Mobile element protein OS=Helicobacter phage FrGC43A OX=1852666 PE=3 SV=1
MM1 pKa = 7.26RR2 pKa = 11.84HH3 pKa = 5.93KK4 pKa = 11.09NEE6 pKa = 3.95TATSFNKK13 pKa = 10.38LKK15 pKa = 10.5EE16 pKa = 3.8ITLAIQAQKK25 pKa = 11.29NSVQTSDD32 pKa = 3.17NANTSEE38 pKa = 4.24ITSQSTPTPKK48 pKa = 9.58GTARR52 pKa = 11.84AKK54 pKa = 10.74NSALKK59 pKa = 7.59PTKK62 pKa = 9.79RR63 pKa = 11.84AFSEE67 pKa = 4.09RR68 pKa = 11.84QRR70 pKa = 11.84ITIRR74 pKa = 11.84DD75 pKa = 3.61NSQASAKK82 pKa = 9.47EE83 pKa = 4.04IKK85 pKa = 10.07RR86 pKa = 11.84GRR88 pKa = 3.52
MM1 pKa = 7.26RR2 pKa = 11.84HH3 pKa = 5.93KK4 pKa = 11.09NEE6 pKa = 3.95TATSFNKK13 pKa = 10.38LKK15 pKa = 10.5EE16 pKa = 3.8ITLAIQAQKK25 pKa = 11.29NSVQTSDD32 pKa = 3.17NANTSEE38 pKa = 4.24ITSQSTPTPKK48 pKa = 9.58GTARR52 pKa = 11.84AKK54 pKa = 10.74NSALKK59 pKa = 7.59PTKK62 pKa = 9.79RR63 pKa = 11.84AFSEE67 pKa = 4.09RR68 pKa = 11.84QRR70 pKa = 11.84ITIRR74 pKa = 11.84DD75 pKa = 3.61NSQASAKK82 pKa = 9.47EE83 pKa = 4.04IKK85 pKa = 10.07RR86 pKa = 11.84GRR88 pKa = 3.52
Molecular weight: 9.77 kDa
Isoelectric point according different methods:
Peptides (in silico digests for buttom-up proteomics)
Below you can find in silico digests of the whole proteome with Trypsin, Chymotrypsin, Trypsin+LysC, LysN, ArgC proteases suitable for different mass spec machines.| Try ESI |
 |
|---|
| ChTry ESI |
 |
|---|
| ArgC ESI |
 |
|---|
| LysN ESI |
 |
|---|
| TryLysC ESI |
 |
|---|
| Try MALDI |
 |
|---|
| ChTry MALDI |
 |
|---|
| ArgC MALDI |
 |
|---|
| LysN MALDI |
 |
|---|
| TryLysC MALDI |
 |
|---|
| Try LTQ |
 |
|---|
| ChTry LTQ |
 |
|---|
| ArgC LTQ |
 |
|---|
| LysN LTQ |
 |
|---|
| TryLysC LTQ |
 |
|---|
| Try MSlow |
 |
|---|
| ChTry MSlow |
 |
|---|
| ArgC MSlow |
 |
|---|
| LysN MSlow |
 |
|---|
| TryLysC MSlow |
 |
|---|
| Try MShigh |
 |
|---|
| ChTry MShigh |
 |
|---|
| ArgC MShigh |
 |
|---|
| LysN MShigh |
 |
|---|
| TryLysC MShigh |
 |
|---|
General Statistics
Number of major isoforms |
Number of additional isoforms |
Number of all proteins |
Number of amino acids |
Min. Seq. Length |
Max. Seq. Length |
Avg. Seq. Length |
Avg. Mol. Weight |
|---|---|---|---|---|---|---|---|
0 |
9868 |
45 |
1561 |
266.7 |
30.63 |
Amino acid frequency
Ala |
Cys |
Asp |
Glu |
Phe |
Gly |
His |
Ile |
Lys |
Leu |
|---|---|---|---|---|---|---|---|---|---|
6.425 ± 0.267 | 0.902 ± 0.233 |
4.884 ± 0.346 | 8.492 ± 0.376 |
4.884 ± 0.251 | 4.185 ± 0.316 |
1.348 ± 0.162 | 7.205 ± 0.304 |
10.965 ± 0.468 | 10.377 ± 0.347 |
Met |
Asn |
Gln |
Pro |
Arg |
Ser |
Thr |
Val |
Trp |
Tyr |
|---|---|---|---|---|---|---|---|---|---|
1.875 ± 0.182 | 8.188 ± 0.472 |
2.219 ± 0.141 | 4.459 ± 0.368 |
3.871 ± 0.232 | 6.668 ± 0.232 |
4.712 ± 0.332 | 4.185 ± 0.358 |
0.476 ± 0.077 | 3.679 ± 0.206 |
Most of the basic statistics you can see at this page can be downloaded from this CSV file
Proteome-pI is available under Creative Commons Attribution-NoDerivs license, for more details see here
| Reference: Kozlowski LP. Proteome-pI 2.0: Proteome Isoelectric Point Database Update. Nucleic Acids Res. 2021, doi: 10.1093/nar/gkab944 | Contact: Lukasz P. Kozlowski |
