Mycobacterium phage Phabba
Taxonomy: Viruses; Duplodnaviria; Heunggongvirae; Uroviricota; Caudoviricetes; Caudovirales; Myoviridae; unclassified Myoviridae
Average proteome isoelectric point is 6.0
Get precalculated fractions of proteins

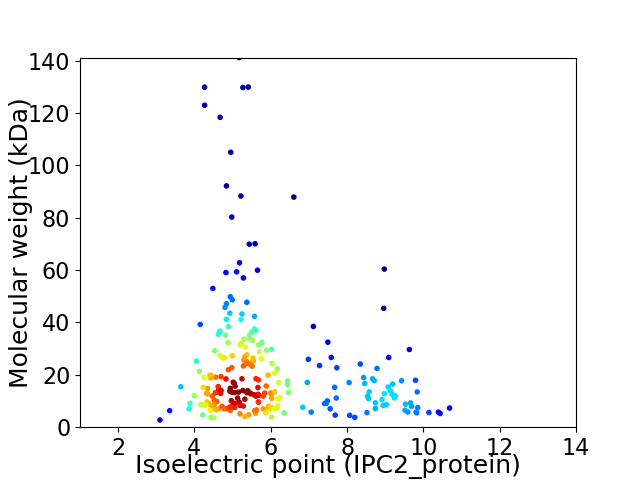
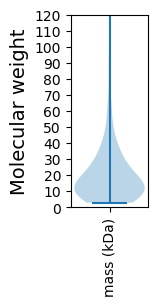
Virtual 2D-PAGE plot for 244 proteins (isoelectric point calculated using IPC2_protein)
Get csv file with sequences according to given criteria:
* You can choose from 21 different methods for calculating isoelectric point
Summary statistics related to proteome-wise predictions


Protein with the lowest isoelectric point:
>tr|A0A249XSA0|A0A249XSA0_9CAUD Esterase OS=Mycobacterium phage Phabba OX=2027899 GN=SEA_PHABBA_36 PE=4 SV=1
MM1 pKa = 7.66PALITFSRR9 pKa = 11.84DD10 pKa = 2.58WADD13 pKa = 3.38EE14 pKa = 4.22FNVDD18 pKa = 3.28GFKK21 pKa = 11.06VVDD24 pKa = 4.1TLAEE28 pKa = 3.95AADD31 pKa = 3.86YY32 pKa = 10.53KK33 pKa = 11.21SHH35 pKa = 6.73FEE37 pKa = 4.1KK38 pKa = 10.64PRR40 pKa = 11.84TYY42 pKa = 11.13YY43 pKa = 10.78FGTNEE48 pKa = 3.68GWEE51 pKa = 4.31DD52 pKa = 3.57EE53 pKa = 4.5VMVDD57 pKa = 3.66SFTITEE63 pKa = 4.17ISDD66 pKa = 3.31HH67 pKa = 6.09EE68 pKa = 4.13AAVLCKK74 pKa = 10.51LLGCAEE80 pKa = 3.99HH81 pKa = 6.53RR82 pKa = 11.84QYY84 pKa = 11.93GHH86 pKa = 6.83VPVDD90 pKa = 3.39WDD92 pKa = 4.89EE93 pKa = 4.99DD94 pKa = 3.94DD95 pKa = 5.74CDD97 pKa = 5.72DD98 pKa = 5.31DD99 pKa = 4.73VSSYY103 pKa = 11.76APP105 pKa = 3.52
MM1 pKa = 7.66PALITFSRR9 pKa = 11.84DD10 pKa = 2.58WADD13 pKa = 3.38EE14 pKa = 4.22FNVDD18 pKa = 3.28GFKK21 pKa = 11.06VVDD24 pKa = 4.1TLAEE28 pKa = 3.95AADD31 pKa = 3.86YY32 pKa = 10.53KK33 pKa = 11.21SHH35 pKa = 6.73FEE37 pKa = 4.1KK38 pKa = 10.64PRR40 pKa = 11.84TYY42 pKa = 11.13YY43 pKa = 10.78FGTNEE48 pKa = 3.68GWEE51 pKa = 4.31DD52 pKa = 3.57EE53 pKa = 4.5VMVDD57 pKa = 3.66SFTITEE63 pKa = 4.17ISDD66 pKa = 3.31HH67 pKa = 6.09EE68 pKa = 4.13AAVLCKK74 pKa = 10.51LLGCAEE80 pKa = 3.99HH81 pKa = 6.53RR82 pKa = 11.84QYY84 pKa = 11.93GHH86 pKa = 6.83VPVDD90 pKa = 3.39WDD92 pKa = 4.89EE93 pKa = 4.99DD94 pKa = 3.94DD95 pKa = 5.74CDD97 pKa = 5.72DD98 pKa = 5.31DD99 pKa = 4.73VSSYY103 pKa = 11.76APP105 pKa = 3.52
Molecular weight: 11.99 kDa
Isoelectric point according different methods:
Protein with the highest isoelectric point:
>tr|A0A249XSR4|A0A249XSR4_9CAUD Uncharacterized protein OS=Mycobacterium phage Phabba OX=2027899 GN=SEA_PHABBA_246 PE=4 SV=1
MM1 pKa = 7.46SNEE4 pKa = 3.63HH5 pKa = 5.46MTPARR10 pKa = 11.84ARR12 pKa = 11.84IEE14 pKa = 4.22TQRR17 pKa = 11.84LLDD20 pKa = 3.6AHH22 pKa = 7.01GLTGWRR28 pKa = 11.84VTFGTARR35 pKa = 11.84TRR37 pKa = 11.84NGSCSYY43 pKa = 8.93STRR46 pKa = 11.84TINLSRR52 pKa = 11.84TLMAFRR58 pKa = 11.84SYY60 pKa = 11.46EE61 pKa = 3.99EE62 pKa = 3.86TLDD65 pKa = 3.98TIRR68 pKa = 11.84HH69 pKa = 4.88EE70 pKa = 4.42VAHH73 pKa = 6.66ALTPGHH79 pKa = 5.84KK80 pKa = 9.34HH81 pKa = 5.73DD82 pKa = 4.57RR83 pKa = 11.84VWAAKK88 pKa = 9.86CRR90 pKa = 11.84EE91 pKa = 4.11LGGNGQRR98 pKa = 11.84CNGIADD104 pKa = 3.66AAKK107 pKa = 10.3RR108 pKa = 11.84EE109 pKa = 4.07QLVQTALWVGTCGHH123 pKa = 6.76GNQFPKK129 pKa = 10.28HH130 pKa = 5.34RR131 pKa = 11.84QPKK134 pKa = 9.64RR135 pKa = 11.84LVGWFCKK142 pKa = 9.73CQPGQKK148 pKa = 8.96TPVVWAKK155 pKa = 9.37TRR157 pKa = 3.29
MM1 pKa = 7.46SNEE4 pKa = 3.63HH5 pKa = 5.46MTPARR10 pKa = 11.84ARR12 pKa = 11.84IEE14 pKa = 4.22TQRR17 pKa = 11.84LLDD20 pKa = 3.6AHH22 pKa = 7.01GLTGWRR28 pKa = 11.84VTFGTARR35 pKa = 11.84TRR37 pKa = 11.84NGSCSYY43 pKa = 8.93STRR46 pKa = 11.84TINLSRR52 pKa = 11.84TLMAFRR58 pKa = 11.84SYY60 pKa = 11.46EE61 pKa = 3.99EE62 pKa = 3.86TLDD65 pKa = 3.98TIRR68 pKa = 11.84HH69 pKa = 4.88EE70 pKa = 4.42VAHH73 pKa = 6.66ALTPGHH79 pKa = 5.84KK80 pKa = 9.34HH81 pKa = 5.73DD82 pKa = 4.57RR83 pKa = 11.84VWAAKK88 pKa = 9.86CRR90 pKa = 11.84EE91 pKa = 4.11LGGNGQRR98 pKa = 11.84CNGIADD104 pKa = 3.66AAKK107 pKa = 10.3RR108 pKa = 11.84EE109 pKa = 4.07QLVQTALWVGTCGHH123 pKa = 6.76GNQFPKK129 pKa = 10.28HH130 pKa = 5.34RR131 pKa = 11.84QPKK134 pKa = 9.64RR135 pKa = 11.84LVGWFCKK142 pKa = 9.73CQPGQKK148 pKa = 8.96TPVVWAKK155 pKa = 9.37TRR157 pKa = 3.29
Molecular weight: 17.74 kDa
Isoelectric point according different methods:
Peptides (in silico digests for buttom-up proteomics)
Below you can find in silico digests of the whole proteome with Trypsin, Chymotrypsin, Trypsin+LysC, LysN, ArgC proteases suitable for different mass spec machines.| Try ESI |
 |
|---|
| ChTry ESI |
 |
|---|
| ArgC ESI |
 |
|---|
| LysN ESI |
 |
|---|
| TryLysC ESI |
 |
|---|
| Try MALDI |
 |
|---|
| ChTry MALDI |
 |
|---|
| ArgC MALDI |
 |
|---|
| LysN MALDI |
 |
|---|
| TryLysC MALDI |
 |
|---|
| Try LTQ |
 |
|---|
| ChTry LTQ |
 |
|---|
| ArgC LTQ |
 |
|---|
| LysN LTQ |
 |
|---|
| TryLysC LTQ |
 |
|---|
| Try MSlow |
 |
|---|
| ChTry MSlow |
 |
|---|
| ArgC MSlow |
 |
|---|
| LysN MSlow |
 |
|---|
| TryLysC MSlow |
 |
|---|
| Try MShigh |
 |
|---|
| ChTry MShigh |
 |
|---|
| ArgC MShigh |
 |
|---|
| LysN MShigh |
 |
|---|
| TryLysC MShigh |
 |
|---|
General Statistics
Number of major isoforms |
Number of additional isoforms |
Number of all proteins |
Number of amino acids |
Min. Seq. Length |
Max. Seq. Length |
Avg. Seq. Length |
Avg. Mol. Weight |
|---|---|---|---|---|---|---|---|
0 |
50768 |
24 |
1256 |
208.1 |
22.99 |
Amino acid frequency
Ala |
Cys |
Asp |
Glu |
Phe |
Gly |
His |
Ile |
Lys |
Leu |
|---|---|---|---|---|---|---|---|---|---|
9.569 ± 0.234 | 0.825 ± 0.078 |
6.975 ± 0.175 | 6.441 ± 0.179 |
3.132 ± 0.112 | 8.448 ± 0.309 |
2.175 ± 0.136 | 4.534 ± 0.128 |
4.367 ± 0.17 | 7.225 ± 0.195 |
Met |
Asn |
Gln |
Pro |
Arg |
Ser |
Thr |
Val |
Trp |
Tyr |
|---|---|---|---|---|---|---|---|---|---|
2.537 ± 0.104 | 3.593 ± 0.113 |
5.584 ± 0.161 | 4.408 ± 0.118 |
6.374 ± 0.186 | 5.498 ± 0.169 |
6.301 ± 0.199 | 7.06 ± 0.187 |
1.824 ± 0.101 | 3.13 ± 0.115 |
Most of the basic statistics you can see at this page can be downloaded from this CSV file
Proteome-pI is available under Creative Commons Attribution-NoDerivs license, for more details see here
| Reference: Kozlowski LP. Proteome-pI 2.0: Proteome Isoelectric Point Database Update. Nucleic Acids Res. 2021, doi: 10.1093/nar/gkab944 | Contact: Lukasz P. Kozlowski |
