Oryzias latipes (Japanese rice fish) (Japanese killifish)
Taxonomy: cellular organisms; Eukaryota; Opisthokonta; Metazoa; Eumetazoa; Bilateria; Deuterostomia; Chordata; Craniata; Vertebrata; Gnathostomata; Teleostomi; Euteleostomi; Actinopterygii; Actinopteri; Neopterygii; Teleostei; Osteoglossocephalai; Clupeocephala; Euteleosteomorpha; Neoteleostei;
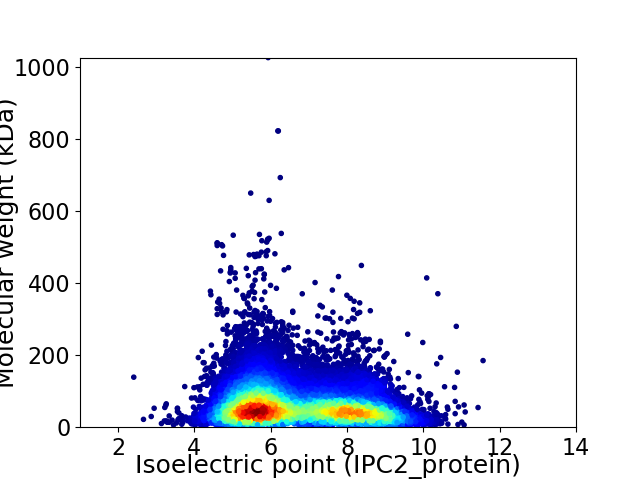
Average proteome isoelectric point is 6.67
Get precalculated fractions of proteins

Virtual 2D-PAGE plot for 36138 proteins (isoelectric point calculated using IPC2_protein)
Get csv file with sequences according to given criteria:
* You can choose from 21 different methods for calculating isoelectric point
Summary statistics related to proteome-wise predictions


Protein with the lowest isoelectric point:
>tr|A0A3B3IDI4|A0A3B3IDI4_ORYLA Uncharacterized protein OS=Oryzias latipes OX=8090 GN=ercc6l2 PE=4 SV=1
MM1 pKa = 7.25NLDD4 pKa = 3.51LKK6 pKa = 10.57VFRR9 pKa = 11.84TIKK12 pKa = 10.27SYY14 pKa = 11.28YY15 pKa = 6.48EE16 pKa = 3.97QKK18 pKa = 10.69GVPPAPRR25 pKa = 11.84PVPAPRR31 pKa = 11.84GVPPAPRR38 pKa = 11.84PVPAPRR44 pKa = 11.84GVPPAPRR51 pKa = 11.84RR52 pKa = 11.84VPSDD56 pKa = 3.46CWPDD60 pKa = 3.7PPEE63 pKa = 4.5PDD65 pKa = 3.7CWPDD69 pKa = 3.75PPEE72 pKa = 4.5PDD74 pKa = 3.7CWPDD78 pKa = 3.75PPEE81 pKa = 4.5PDD83 pKa = 3.7CWPDD87 pKa = 3.75PPEE90 pKa = 4.5PDD92 pKa = 3.7CWPDD96 pKa = 3.75PPEE99 pKa = 4.5PDD101 pKa = 3.7CWPDD105 pKa = 3.75PPEE108 pKa = 4.5PDD110 pKa = 3.7CWPDD114 pKa = 3.75PPEE117 pKa = 4.5PDD119 pKa = 3.7CWPDD123 pKa = 3.75PPEE126 pKa = 4.5PDD128 pKa = 3.7CWPDD132 pKa = 3.75PPEE135 pKa = 4.5PDD137 pKa = 3.7CWPDD141 pKa = 3.75PPEE144 pKa = 4.5PDD146 pKa = 3.7CWPDD150 pKa = 3.33PPEE153 pKa = 4.48RR154 pKa = 11.84CSGQIKK160 pKa = 10.12PILNFLVTMM169 pKa = 5.23
MM1 pKa = 7.25NLDD4 pKa = 3.51LKK6 pKa = 10.57VFRR9 pKa = 11.84TIKK12 pKa = 10.27SYY14 pKa = 11.28YY15 pKa = 6.48EE16 pKa = 3.97QKK18 pKa = 10.69GVPPAPRR25 pKa = 11.84PVPAPRR31 pKa = 11.84GVPPAPRR38 pKa = 11.84PVPAPRR44 pKa = 11.84GVPPAPRR51 pKa = 11.84RR52 pKa = 11.84VPSDD56 pKa = 3.46CWPDD60 pKa = 3.7PPEE63 pKa = 4.5PDD65 pKa = 3.7CWPDD69 pKa = 3.75PPEE72 pKa = 4.5PDD74 pKa = 3.7CWPDD78 pKa = 3.75PPEE81 pKa = 4.5PDD83 pKa = 3.7CWPDD87 pKa = 3.75PPEE90 pKa = 4.5PDD92 pKa = 3.7CWPDD96 pKa = 3.75PPEE99 pKa = 4.5PDD101 pKa = 3.7CWPDD105 pKa = 3.75PPEE108 pKa = 4.5PDD110 pKa = 3.7CWPDD114 pKa = 3.75PPEE117 pKa = 4.5PDD119 pKa = 3.7CWPDD123 pKa = 3.75PPEE126 pKa = 4.5PDD128 pKa = 3.7CWPDD132 pKa = 3.75PPEE135 pKa = 4.5PDD137 pKa = 3.7CWPDD141 pKa = 3.75PPEE144 pKa = 4.5PDD146 pKa = 3.7CWPDD150 pKa = 3.33PPEE153 pKa = 4.48RR154 pKa = 11.84CSGQIKK160 pKa = 10.12PILNFLVTMM169 pKa = 5.23
Molecular weight: 19.09 kDa
Isoelectric point according different methods:
Protein with the highest isoelectric point:
>tr|A0A3B3HLF6|A0A3B3HLF6_ORYLA DZF domain-containing protein OS=Oryzias latipes OX=8090 GN=zfr PE=4 SV=1
RR1 pKa = 7.11AVRR4 pKa = 11.84RR5 pKa = 11.84GRR7 pKa = 11.84SGGRR11 pKa = 11.84LGGVGHH17 pKa = 6.24GVRR20 pKa = 11.84LGGVGHH26 pKa = 6.11GVRR29 pKa = 11.84LGGVGHH35 pKa = 6.11GVRR38 pKa = 11.84LGGVGHH44 pKa = 6.54GARR47 pKa = 11.84LGGVGHH53 pKa = 6.65GARR56 pKa = 11.84LGGVGHH62 pKa = 6.65GARR65 pKa = 11.84LGGVGHH71 pKa = 6.21GVRR74 pKa = 11.84LGGVGPAVRR83 pKa = 11.84LWRR86 pKa = 11.84VGRR89 pKa = 3.84
RR1 pKa = 7.11AVRR4 pKa = 11.84RR5 pKa = 11.84GRR7 pKa = 11.84SGGRR11 pKa = 11.84LGGVGHH17 pKa = 6.24GVRR20 pKa = 11.84LGGVGHH26 pKa = 6.11GVRR29 pKa = 11.84LGGVGHH35 pKa = 6.11GVRR38 pKa = 11.84LGGVGHH44 pKa = 6.54GARR47 pKa = 11.84LGGVGHH53 pKa = 6.65GARR56 pKa = 11.84LGGVGHH62 pKa = 6.65GARR65 pKa = 11.84LGGVGHH71 pKa = 6.21GVRR74 pKa = 11.84LGGVGPAVRR83 pKa = 11.84LWRR86 pKa = 11.84VGRR89 pKa = 3.84
Molecular weight: 8.55 kDa
Isoelectric point according different methods:
Peptides (in silico digests for buttom-up proteomics)
Below you can find in silico digests of the whole proteome with Trypsin, Chymotrypsin, Trypsin+LysC, LysN, ArgC proteases suitable for different mass spec machines.| Try ESI |
 |
|---|
| ChTry ESI |
 |
|---|
| ArgC ESI |
 |
|---|
| LysN ESI |
 |
|---|
| TryLysC ESI |
 |
|---|
| Try MALDI |
 |
|---|
| ChTry MALDI |
 |
|---|
| ArgC MALDI |
 |
|---|
| LysN MALDI |
 |
|---|
| TryLysC MALDI |
 |
|---|
| Try LTQ |
 |
|---|
| ChTry LTQ |
 |
|---|
| ArgC LTQ |
 |
|---|
| LysN LTQ |
 |
|---|
| TryLysC LTQ |
 |
|---|
| Try MSlow |
 |
|---|
| ChTry MSlow |
 |
|---|
| ArgC MSlow |
 |
|---|
| LysN MSlow |
 |
|---|
| TryLysC MSlow |
 |
|---|
| Try MShigh |
 |
|---|
| ChTry MShigh |
 |
|---|
| ArgC MShigh |
 |
|---|
| LysN MShigh |
 |
|---|
| TryLysC MShigh |
 |
|---|
General Statistics
Number of major isoforms |
Number of additional isoforms |
Number of all proteins |
Number of amino acids |
Min. Seq. Length |
Max. Seq. Length |
Avg. Seq. Length |
Avg. Mol. Weight |
|---|---|---|---|---|---|---|---|
21724183 |
15 |
9615 |
601.1 |
67.1 |
Amino acid frequency
Ala |
Cys |
Asp |
Glu |
Phe |
Gly |
His |
Ile |
Lys |
Leu |
|---|---|---|---|---|---|---|---|---|---|
6.543 ± 0.012 | 2.249 ± 0.011 |
5.095 ± 0.009 | 6.816 ± 0.021 |
3.721 ± 0.01 | 6.225 ± 0.018 |
2.71 ± 0.012 | 4.376 ± 0.012 |
5.701 ± 0.015 | 9.546 ± 0.014 |
Met |
Asn |
Gln |
Pro |
Arg |
Ser |
Thr |
Val |
Trp |
Tyr |
|---|---|---|---|---|---|---|---|---|---|
2.311 ± 0.005 | 3.821 ± 0.007 |
5.874 ± 0.016 | 4.726 ± 0.011 |
5.715 ± 0.012 | 8.974 ± 0.018 |
5.557 ± 0.016 | 6.265 ± 0.013 |
1.152 ± 0.005 | 2.625 ± 0.007 |
Most of the basic statistics you can see at this page can be downloaded from this CSV file
Proteome-pI is available under Creative Commons Attribution-NoDerivs license, for more details see here
| Reference: Kozlowski LP. Proteome-pI 2.0: Proteome Isoelectric Point Database Update. Nucleic Acids Res. 2021, doi: 10.1093/nar/gkab944 | Contact: Lukasz P. Kozlowski |
