Cimex lectularius (Bed bug) (Acanthia lectularia)
Taxonomy: cellular organisms; Eukaryota; Opisthokonta; Metazoa; Eumetazoa; Bilateria; Protostomia; Ecdysozoa; Panarthropoda; Arthropoda; Mandibulata; Pancrustacea; Hexapoda; Insecta; Dicondylia; Pterygota; Neoptera; Paraneoptera; Hemiptera; Prosorrhyncha; Heteroptera; Euheteroptera; Neoheteroptera; Panheteroptera;
Average proteome isoelectric point is 7.03
Get precalculated fractions of proteins
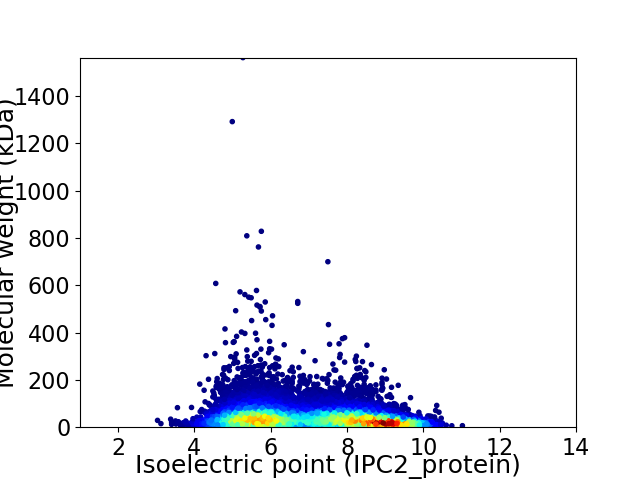
Virtual 2D-PAGE plot for 14152 proteins (isoelectric point calculated using IPC2_protein)
Get csv file with sequences according to given criteria:
* You can choose from 21 different methods for calculating isoelectric point
Summary statistics related to proteome-wise predictions
Protein with the lowest isoelectric point:
>tr|A0A7E4RCQ5|A0A7E4RCQ5_CIMLE Uncharacterized protein OS=Cimex lectularius OX=79782 PE=4 SV=1
MM1 pKa = 8.43AMIFLFGLVLTSGSSRR17 pKa = 11.84SQDD20 pKa = 3.46LTSDD24 pKa = 3.6DD25 pKa = 3.68YY26 pKa = 11.86DD27 pKa = 3.82YY28 pKa = 12.18ANITSNDD35 pKa = 3.36TSQGAGQIMFWNEE48 pKa = 3.08TSFNDD53 pKa = 4.17TALLDD58 pKa = 3.63IPLQSEE64 pKa = 4.67SPGFWEE70 pKa = 5.66AYY72 pKa = 8.29EE73 pKa = 4.3SQNGTVLEE81 pKa = 4.8SISFHH86 pKa = 6.71PNPVTYY92 pKa = 10.69GLLDD96 pKa = 3.78GEE98 pKa = 4.86TAVTPYY104 pKa = 9.75MGEE107 pKa = 3.69EE108 pKa = 4.12DD109 pKa = 4.5AVSKK113 pKa = 10.56PVGDD117 pKa = 4.22LWPVKK122 pKa = 10.02LAAEE126 pKa = 4.38VPGDD130 pKa = 4.49LILGGLMMVHH140 pKa = 5.93EE141 pKa = 5.23RR142 pKa = 11.84EE143 pKa = 4.2DD144 pKa = 4.07TITCGPVMPQGGIQAVEE161 pKa = 3.77IMLYY165 pKa = 9.21TLDD168 pKa = 4.91IINEE172 pKa = 4.15RR173 pKa = 11.84LGHH176 pKa = 4.98YY177 pKa = 8.83TLGAHH182 pKa = 7.29ILDD185 pKa = 4.86DD186 pKa = 4.5CDD188 pKa = 4.21KK189 pKa = 10.3DD190 pKa = 3.98TYY192 pKa = 9.98GLEE195 pKa = 4.02MAVDD199 pKa = 4.68FIKK202 pKa = 11.0GKK204 pKa = 10.43LNFYY208 pKa = 9.6FVKK211 pKa = 9.99TT212 pKa = 3.8
MM1 pKa = 8.43AMIFLFGLVLTSGSSRR17 pKa = 11.84SQDD20 pKa = 3.46LTSDD24 pKa = 3.6DD25 pKa = 3.68YY26 pKa = 11.86DD27 pKa = 3.82YY28 pKa = 12.18ANITSNDD35 pKa = 3.36TSQGAGQIMFWNEE48 pKa = 3.08TSFNDD53 pKa = 4.17TALLDD58 pKa = 3.63IPLQSEE64 pKa = 4.67SPGFWEE70 pKa = 5.66AYY72 pKa = 8.29EE73 pKa = 4.3SQNGTVLEE81 pKa = 4.8SISFHH86 pKa = 6.71PNPVTYY92 pKa = 10.69GLLDD96 pKa = 3.78GEE98 pKa = 4.86TAVTPYY104 pKa = 9.75MGEE107 pKa = 3.69EE108 pKa = 4.12DD109 pKa = 4.5AVSKK113 pKa = 10.56PVGDD117 pKa = 4.22LWPVKK122 pKa = 10.02LAAEE126 pKa = 4.38VPGDD130 pKa = 4.49LILGGLMMVHH140 pKa = 5.93EE141 pKa = 5.23RR142 pKa = 11.84EE143 pKa = 4.2DD144 pKa = 4.07TITCGPVMPQGGIQAVEE161 pKa = 3.77IMLYY165 pKa = 9.21TLDD168 pKa = 4.91IINEE172 pKa = 4.15RR173 pKa = 11.84LGHH176 pKa = 4.98YY177 pKa = 8.83TLGAHH182 pKa = 7.29ILDD185 pKa = 4.86DD186 pKa = 4.5CDD188 pKa = 4.21KK189 pKa = 10.3DD190 pKa = 3.98TYY192 pKa = 9.98GLEE195 pKa = 4.02MAVDD199 pKa = 4.68FIKK202 pKa = 11.0GKK204 pKa = 10.43LNFYY208 pKa = 9.6FVKK211 pKa = 9.99TT212 pKa = 3.8
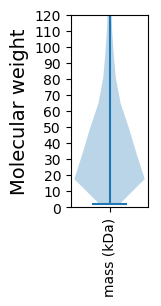
Molecular weight: 23.28 kDa
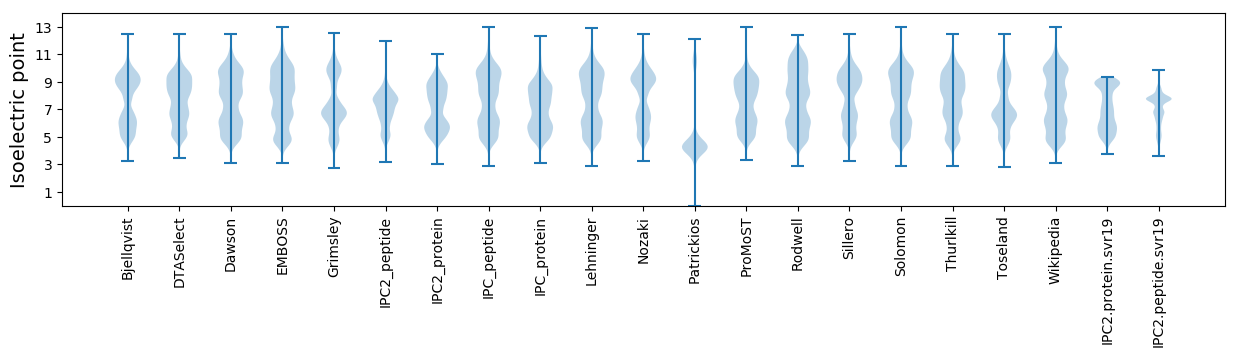
Isoelectric point according different methods:
Protein with the highest isoelectric point:
>tr|A0A7E4S0M5|A0A7E4S0M5_CIMLE L-lactate dehydrogenase OS=Cimex lectularius OX=79782 PE=3 SV=1
MM1 pKa = 7.41SAHH4 pKa = 6.35KK5 pKa = 9.26TFKK8 pKa = 10.71VKK10 pKa = 10.47QKK12 pKa = 10.09LAKK15 pKa = 9.8KK16 pKa = 9.96LKK18 pKa = 8.58QNRR21 pKa = 11.84PIPQWIRR28 pKa = 11.84MRR30 pKa = 11.84TGNTIRR36 pKa = 11.84YY37 pKa = 5.79NAKK40 pKa = 8.47RR41 pKa = 11.84RR42 pKa = 11.84HH43 pKa = 4.1WRR45 pKa = 11.84RR46 pKa = 11.84TKK48 pKa = 10.89LKK50 pKa = 10.55LL51 pKa = 3.39
MM1 pKa = 7.41SAHH4 pKa = 6.35KK5 pKa = 9.26TFKK8 pKa = 10.71VKK10 pKa = 10.47QKK12 pKa = 10.09LAKK15 pKa = 9.8KK16 pKa = 9.96LKK18 pKa = 8.58QNRR21 pKa = 11.84PIPQWIRR28 pKa = 11.84MRR30 pKa = 11.84TGNTIRR36 pKa = 11.84YY37 pKa = 5.79NAKK40 pKa = 8.47RR41 pKa = 11.84RR42 pKa = 11.84HH43 pKa = 4.1WRR45 pKa = 11.84RR46 pKa = 11.84TKK48 pKa = 10.89LKK50 pKa = 10.55LL51 pKa = 3.39
Molecular weight: 6.34 kDa
Isoelectric point according different methods:
Peptides (in silico digests for buttom-up proteomics)
Below you can find in silico digests of the whole proteome with Trypsin, Chymotrypsin, Trypsin+LysC, LysN, ArgC proteases suitable for different mass spec machines.| Try ESI |
 |
|---|
| ChTry ESI |
|
|---|
| ArgC ESI |
|
|---|
| LysN ESI |
|
|---|
| TryLysC ESI |
|
|---|
| Try MALDI |
|
|---|
| ChTry MALDI |
|
|---|
| ArgC MALDI |
|
|---|
| LysN MALDI |
|
|---|
| TryLysC MALDI |
|
|---|
| Try LTQ |
|
|---|
| ChTry LTQ |
|
|---|
| ArgC LTQ |
|
|---|
| LysN LTQ |
|
|---|
| TryLysC LTQ |
|
|---|
| Try MSlow |
|
|---|
| ChTry MSlow |
|
|---|
| ArgC MSlow |
|
|---|
| LysN MSlow |
|
|---|
| TryLysC MSlow |
|
|---|
| Try MShigh |
|
|---|
| ChTry MShigh |
|
|---|
| ArgC MShigh |
|
|---|
| LysN MShigh |
|
|---|
| TryLysC MShigh |
|
|---|
General Statistics
Number of major isoforms |
Number of additional isoforms |
Number of all proteins |
Number of amino acids |
Min. Seq. Length |
Max. Seq. Length |
Avg. Seq. Length |
Avg. Mol. Weight |
|---|---|---|---|---|---|---|---|
5704716 |
14 |
13863 |
403.1 |
45.5 |
Amino acid frequency
Ala |
Cys |
Asp |
Glu |
Phe |
Gly |
His |
Ile |
Lys |
Leu |
|---|---|---|---|---|---|---|---|---|---|
5.758 ± 0.021 | 1.996 ± 0.029 |
5.234 ± 0.017 | 6.732 ± 0.032 |
4.187 ± 0.02 | 5.818 ± 0.034 |
2.467 ± 0.012 | 5.96 ± 0.024 |
7.042 ± 0.029 | 9.361 ± 0.035 |
Met |
Asn |
Gln |
Pro |
Arg |
Ser |
Thr |
Val |
Trp |
Tyr |
|---|---|---|---|---|---|---|---|---|---|
2.401 ± 0.01 | 4.913 ± 0.017 |
4.976 ± 0.033 | 3.917 ± 0.02 |
5.042 ± 0.019 | 7.704 ± 0.027 |
5.61 ± 0.017 | 6.44 ± 0.017 |
1.124 ± 0.009 | 3.31 ± 0.014 |
Most of the basic statistics you can see at this page can be downloaded from this CSV file
See this proteome in:

Proteome-pI is available under Creative Commons Attribution-NoDerivs license, for more details see here
| Reference: Kozlowski LP. Proteome-pI 2.0: Proteome Isoelectric Point Database Update. Nucleic Acids Res. 2021, doi: 10.1093/nar/gkab944 | Contact: Lukasz P. Kozlowski |