Eggerthella sp. CAG:209
Taxonomy: cellular organisms; Bacteria; Terrabacteria group; Actinobacteria; Coriobacteriia; Eggerthellales; Eggerthellaceae; Eggerthella; environmental samples
Average proteome isoelectric point is 5.93
Get precalculated fractions of proteins
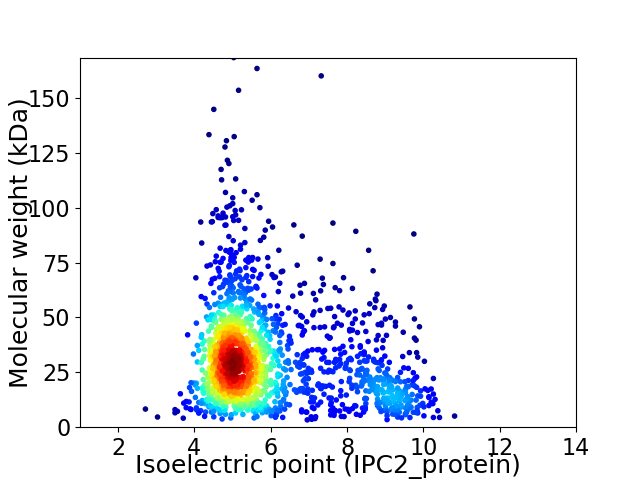
Virtual 2D-PAGE plot for 1726 proteins (isoelectric point calculated using IPC2_protein)
Get csv file with sequences according to given criteria:
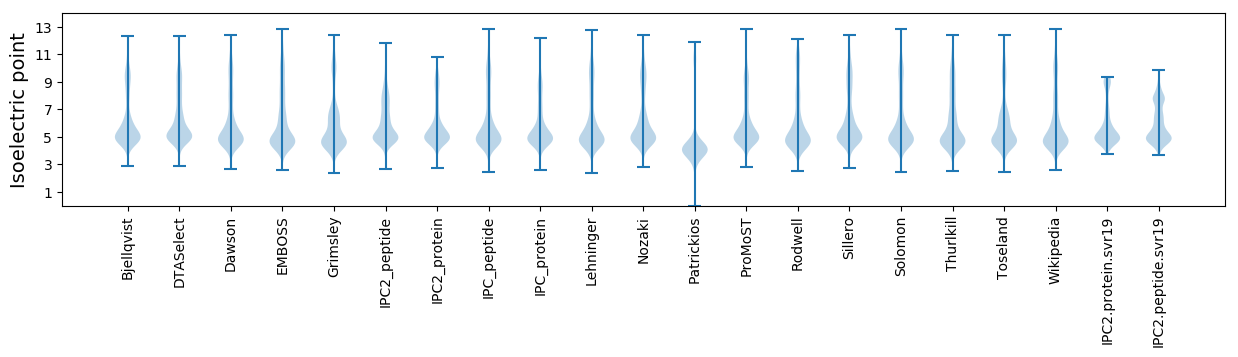
* You can choose from 21 different methods for calculating isoelectric point
Summary statistics related to proteome-wise predictions
Protein with the lowest isoelectric point:
>tr|R6HII0|R6HII0_9ACTN Probable cell division protein WhiA OS=Eggerthella sp. CAG:209 OX=1262875 GN=whiA PE=3 SV=1
MM1 pKa = 7.39TFDD4 pKa = 5.17EE5 pKa = 5.67LDD7 pKa = 3.63EE8 pKa = 4.32QQTKK12 pKa = 9.72AALYY16 pKa = 9.76VLEE19 pKa = 4.97LADD22 pKa = 4.7IEE24 pKa = 4.36PTRR27 pKa = 11.84EE28 pKa = 3.55NARR31 pKa = 11.84LYY33 pKa = 10.14LAWDD37 pKa = 3.52VLSFTEE43 pKa = 4.45DD44 pKa = 3.09AQGRR48 pKa = 11.84YY49 pKa = 7.54CWYY52 pKa = 9.65MDD54 pKa = 3.95DD55 pKa = 4.89EE56 pKa = 4.89GNEE59 pKa = 3.79ACIKK63 pKa = 10.24VDD65 pKa = 3.28SLEE68 pKa = 4.33IIEE71 pKa = 4.25TSEE74 pKa = 4.1YY75 pKa = 10.4EE76 pKa = 3.91
MM1 pKa = 7.39TFDD4 pKa = 5.17EE5 pKa = 5.67LDD7 pKa = 3.63EE8 pKa = 4.32QQTKK12 pKa = 9.72AALYY16 pKa = 9.76VLEE19 pKa = 4.97LADD22 pKa = 4.7IEE24 pKa = 4.36PTRR27 pKa = 11.84EE28 pKa = 3.55NARR31 pKa = 11.84LYY33 pKa = 10.14LAWDD37 pKa = 3.52VLSFTEE43 pKa = 4.45DD44 pKa = 3.09AQGRR48 pKa = 11.84YY49 pKa = 7.54CWYY52 pKa = 9.65MDD54 pKa = 3.95DD55 pKa = 4.89EE56 pKa = 4.89GNEE59 pKa = 3.79ACIKK63 pKa = 10.24VDD65 pKa = 3.28SLEE68 pKa = 4.33IIEE71 pKa = 4.25TSEE74 pKa = 4.1YY75 pKa = 10.4EE76 pKa = 3.91
Molecular weight: 8.91 kDa
Isoelectric point according different methods:
Protein with the highest isoelectric point:
>tr|R6I826|R6I826_9ACTN FHA domain-containing protein OS=Eggerthella sp. CAG:209 OX=1262875 GN=BN534_00314 PE=4 SV=1
MM1 pKa = 7.8RR2 pKa = 11.84IIAGFRR8 pKa = 11.84QVFEE12 pKa = 4.4RR13 pKa = 11.84EE14 pKa = 4.11IIGTTTSVEE23 pKa = 4.27VTCAQIHH30 pKa = 6.44CIGASFYY37 pKa = 11.33GCVQTFHH44 pKa = 6.14VASRR48 pKa = 11.84GQKK51 pKa = 9.63LHH53 pKa = 5.28VLRR56 pKa = 11.84ARR58 pKa = 11.84SSHH61 pKa = 5.89HH62 pKa = 6.46ASFVLLIGFLVHH74 pKa = 6.6GFVSHH79 pKa = 6.21TFVLKK84 pKa = 10.54PLDD87 pKa = 3.71KK88 pKa = 10.73ARR90 pKa = 11.84KK91 pKa = 8.06RR92 pKa = 11.84PSSSMMAVSLHH103 pKa = 6.76CYY105 pKa = 9.43AALRR109 pKa = 4.07
MM1 pKa = 7.8RR2 pKa = 11.84IIAGFRR8 pKa = 11.84QVFEE12 pKa = 4.4RR13 pKa = 11.84EE14 pKa = 4.11IIGTTTSVEE23 pKa = 4.27VTCAQIHH30 pKa = 6.44CIGASFYY37 pKa = 11.33GCVQTFHH44 pKa = 6.14VASRR48 pKa = 11.84GQKK51 pKa = 9.63LHH53 pKa = 5.28VLRR56 pKa = 11.84ARR58 pKa = 11.84SSHH61 pKa = 5.89HH62 pKa = 6.46ASFVLLIGFLVHH74 pKa = 6.6GFVSHH79 pKa = 6.21TFVLKK84 pKa = 10.54PLDD87 pKa = 3.71KK88 pKa = 10.73ARR90 pKa = 11.84KK91 pKa = 8.06RR92 pKa = 11.84PSSSMMAVSLHH103 pKa = 6.76CYY105 pKa = 9.43AALRR109 pKa = 4.07
Molecular weight: 12.13 kDa
Isoelectric point according different methods:
Peptides (in silico digests for buttom-up proteomics)
Below you can find in silico digests of the whole proteome with Trypsin, Chymotrypsin, Trypsin+LysC, LysN, ArgC proteases suitable for different mass spec machines.| Try ESI |
 |
|---|
| ChTry ESI |
|
|---|
| ArgC ESI |
|
|---|
| LysN ESI |
|
|---|
| TryLysC ESI |
|
|---|
| Try MALDI |
|
|---|
| ChTry MALDI |
|
|---|
| ArgC MALDI |
|
|---|
| LysN MALDI |
|
|---|
| TryLysC MALDI |
|
|---|
| Try LTQ |
|
|---|
| ChTry LTQ |
|
|---|
| ArgC LTQ |
|
|---|
| LysN LTQ |
|
|---|
| TryLysC LTQ |
|
|---|
| Try MSlow |
|
|---|
| ChTry MSlow |
|
|---|
| ArgC MSlow |
|
|---|
| LysN MSlow |
|
|---|
| TryLysC MSlow |
|
|---|
| Try MShigh |
|
|---|
| ChTry MShigh |
|
|---|
| ArgC MShigh |
|
|---|
| LysN MShigh |
|
|---|
| TryLysC MShigh |
|
|---|
General Statistics
Number of major isoforms |
Number of additional isoforms |
Number of all proteins |
Number of amino acids |
Min. Seq. Length |
Max. Seq. Length |
Avg. Seq. Length |
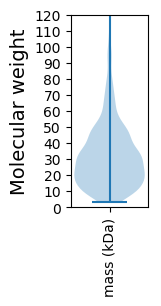
Avg. Mol. Weight |
|---|---|---|---|---|---|---|---|
0 |
519372 |
30 |
1543 |
300.9 |
32.92 |
Amino acid frequency
Ala |
Cys |
Asp |
Glu |
Phe |
Gly |
His |
Ile |
Lys |
Leu |
|---|---|---|---|---|---|---|---|---|---|
10.366 ± 0.08 | 1.73 ± 0.031 |
5.627 ± 0.054 | 6.855 ± 0.066 |
4.022 ± 0.047 | 7.824 ± 0.059 |
2.006 ± 0.031 | 5.717 ± 0.051 |
4.689 ± 0.046 | 9.109 ± 0.068 |
Met |
Asn |
Gln |
Pro |
Arg |
Ser |
Thr |
Val |
Trp |
Tyr |
|---|---|---|---|---|---|---|---|---|---|
2.68 ± 0.031 | 3.478 ± 0.033 |
4.033 ± 0.034 | 3.175 ± 0.031 |
5.367 ± 0.057 | 6.467 ± 0.063 |
5.21 ± 0.046 | 7.796 ± 0.059 |
0.954 ± 0.024 | 2.878 ± 0.032 |
Most of the basic statistics you can see at this page can be downloaded from this CSV file
See this proteome in:

Proteome-pI is available under Creative Commons Attribution-NoDerivs license, for more details see here
| Reference: Kozlowski LP. Proteome-pI 2.0: Proteome Isoelectric Point Database Update. Nucleic Acids Res. 2021, doi: 10.1093/nar/gkab944 | Contact: Lukasz P. Kozlowski |