bacterium D16-59
Taxonomy: cellular organisms; Bacteria; unclassified Bacteria
Average proteome isoelectric point is 6.34
Get precalculated fractions of proteins

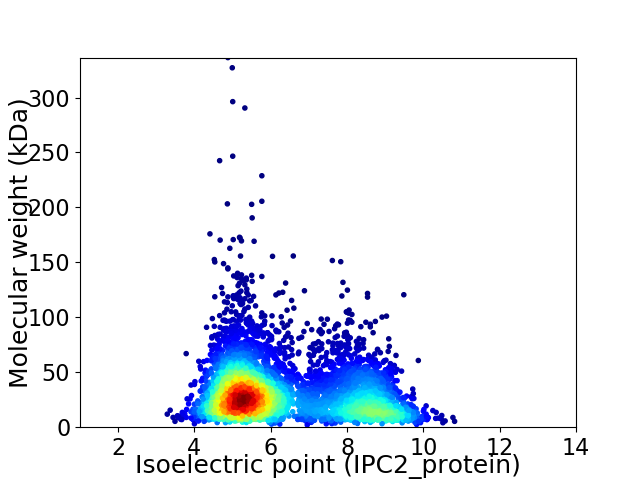
Virtual 2D-PAGE plot for 5054 proteins (isoelectric point calculated using IPC2_protein)
Get csv file with sequences according to given criteria:
* You can choose from 21 different methods for calculating isoelectric point
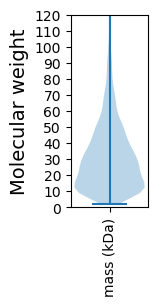
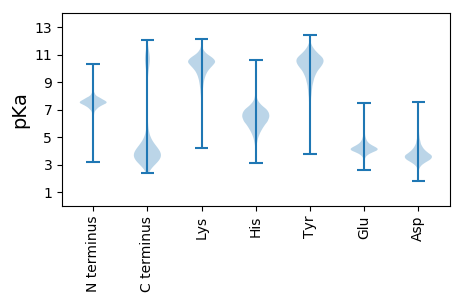
Summary statistics related to proteome-wise predictions


Protein with the lowest isoelectric point:
>tr|A0A3A8WJ90|A0A3A8WJ90_9BACT XRE family transcriptional regulator OS=bacterium D16-59 OX=2320098 GN=D7V96_17805 PE=4 SV=1
MM1 pKa = 7.79ANVTLDD7 pKa = 3.81AEE9 pKa = 4.42TLYY12 pKa = 9.13YY13 pKa = 10.75QYY15 pKa = 10.31MINHH19 pKa = 6.29NPTSTMLNAISGNSSDD35 pKa = 4.89DD36 pKa = 3.5SSLGLMGSLGALNSLGSLDD55 pKa = 3.89ALGMSGLSGISGALGSLDD73 pKa = 3.2SSGSVLSFANVLEE86 pKa = 4.23QCLSSAKK93 pKa = 8.93ATAYY97 pKa = 9.62TEE99 pKa = 4.34SIEE102 pKa = 4.08AAEE105 pKa = 4.32MADD108 pKa = 3.44KK109 pKa = 10.85LSSVLEE115 pKa = 4.19EE116 pKa = 4.04AAGTEE121 pKa = 4.43DD122 pKa = 4.42TSSLTYY128 pKa = 9.29KK129 pKa = 9.79TVQEE133 pKa = 4.03LYY135 pKa = 9.89EE136 pKa = 4.14YY137 pKa = 10.47FSEE140 pKa = 4.47KK141 pKa = 10.37VSSKK145 pKa = 10.54AASLLGDD152 pKa = 3.39AAGTGKK158 pKa = 10.61AGTTSAASSAGGVASSVEE176 pKa = 4.11QMNQAAMKK184 pKa = 9.73GQEE187 pKa = 3.96FDD189 pKa = 3.78FSEE192 pKa = 4.12MDD194 pKa = 3.4AMVDD198 pKa = 3.44AAFEE202 pKa = 4.19EE203 pKa = 4.3QMPLSS208 pKa = 3.96
MM1 pKa = 7.79ANVTLDD7 pKa = 3.81AEE9 pKa = 4.42TLYY12 pKa = 9.13YY13 pKa = 10.75QYY15 pKa = 10.31MINHH19 pKa = 6.29NPTSTMLNAISGNSSDD35 pKa = 4.89DD36 pKa = 3.5SSLGLMGSLGALNSLGSLDD55 pKa = 3.89ALGMSGLSGISGALGSLDD73 pKa = 3.2SSGSVLSFANVLEE86 pKa = 4.23QCLSSAKK93 pKa = 8.93ATAYY97 pKa = 9.62TEE99 pKa = 4.34SIEE102 pKa = 4.08AAEE105 pKa = 4.32MADD108 pKa = 3.44KK109 pKa = 10.85LSSVLEE115 pKa = 4.19EE116 pKa = 4.04AAGTEE121 pKa = 4.43DD122 pKa = 4.42TSSLTYY128 pKa = 9.29KK129 pKa = 9.79TVQEE133 pKa = 4.03LYY135 pKa = 9.89EE136 pKa = 4.14YY137 pKa = 10.47FSEE140 pKa = 4.47KK141 pKa = 10.37VSSKK145 pKa = 10.54AASLLGDD152 pKa = 3.39AAGTGKK158 pKa = 10.61AGTTSAASSAGGVASSVEE176 pKa = 4.11QMNQAAMKK184 pKa = 9.73GQEE187 pKa = 3.96FDD189 pKa = 3.78FSEE192 pKa = 4.12MDD194 pKa = 3.4AMVDD198 pKa = 3.44AAFEE202 pKa = 4.19EE203 pKa = 4.3QMPLSS208 pKa = 3.96
Molecular weight: 21.27 kDa
Isoelectric point according different methods:
Protein with the highest isoelectric point:
>tr|A0A3A8W219|A0A3A8W219_9BACT Uncharacterized protein OS=bacterium D16-59 OX=2320098 GN=D7V96_23845 PE=4 SV=1
MM1 pKa = 7.32PRR3 pKa = 11.84WHH5 pKa = 6.84KK6 pKa = 7.49MTWKK10 pKa = 10.08GFVPRR15 pKa = 11.84WHH17 pKa = 6.31KK18 pKa = 8.08VTWRR22 pKa = 11.84EE23 pKa = 4.6FVPRR27 pKa = 11.84WHH29 pKa = 6.47KK30 pKa = 7.97VTWRR34 pKa = 11.84GFVPRR39 pKa = 11.84WHH41 pKa = 6.36KK42 pKa = 8.49VTWKK46 pKa = 10.2GFVPRR51 pKa = 11.84WHH53 pKa = 6.37KK54 pKa = 8.49VTWKK58 pKa = 10.2GFVPRR63 pKa = 11.84WHH65 pKa = 6.58KK66 pKa = 11.02VII68 pKa = 4.51
MM1 pKa = 7.32PRR3 pKa = 11.84WHH5 pKa = 6.84KK6 pKa = 7.49MTWKK10 pKa = 10.08GFVPRR15 pKa = 11.84WHH17 pKa = 6.31KK18 pKa = 8.08VTWRR22 pKa = 11.84EE23 pKa = 4.6FVPRR27 pKa = 11.84WHH29 pKa = 6.47KK30 pKa = 7.97VTWRR34 pKa = 11.84GFVPRR39 pKa = 11.84WHH41 pKa = 6.36KK42 pKa = 8.49VTWKK46 pKa = 10.2GFVPRR51 pKa = 11.84WHH53 pKa = 6.37KK54 pKa = 8.49VTWKK58 pKa = 10.2GFVPRR63 pKa = 11.84WHH65 pKa = 6.58KK66 pKa = 11.02VII68 pKa = 4.51
Molecular weight: 8.84 kDa
Isoelectric point according different methods:
Peptides (in silico digests for buttom-up proteomics)
Below you can find in silico digests of the whole proteome with Trypsin, Chymotrypsin, Trypsin+LysC, LysN, ArgC proteases suitable for different mass spec machines.| Try ESI |
 |
|---|
| ChTry ESI |
 |
|---|
| ArgC ESI |
 |
|---|
| LysN ESI |
 |
|---|
| TryLysC ESI |
 |
|---|
| Try MALDI |
 |
|---|
| ChTry MALDI |
 |
|---|
| ArgC MALDI |
 |
|---|
| LysN MALDI |
 |
|---|
| TryLysC MALDI |
 |
|---|
| Try LTQ |
 |
|---|
| ChTry LTQ |
 |
|---|
| ArgC LTQ |
 |
|---|
| LysN LTQ |
 |
|---|
| TryLysC LTQ |
 |
|---|
| Try MSlow |
 |
|---|
| ChTry MSlow |
 |
|---|
| ArgC MSlow |
 |
|---|
| LysN MSlow |
 |
|---|
| TryLysC MSlow |
 |
|---|
| Try MShigh |
 |
|---|
| ChTry MShigh |
 |
|---|
| ArgC MShigh |
 |
|---|
| LysN MShigh |
 |
|---|
| TryLysC MShigh |
 |
|---|
General Statistics
Number of major isoforms |
Number of additional isoforms |
Number of all proteins |
Number of amino acids |
Min. Seq. Length |
Max. Seq. Length |
Avg. Seq. Length |
Avg. Mol. Weight |
|---|---|---|---|---|---|---|---|
0 |
1488312 |
19 |
2992 |
294.5 |
33.26 |
Amino acid frequency
Ala |
Cys |
Asp |
Glu |
Phe |
Gly |
His |
Ile |
Lys |
Leu |
|---|---|---|---|---|---|---|---|---|---|
7.133 ± 0.037 | 1.581 ± 0.016 |
5.446 ± 0.027 | 7.922 ± 0.048 |
4.258 ± 0.025 | 6.847 ± 0.032 |
1.657 ± 0.017 | 7.268 ± 0.037 |
7.737 ± 0.036 | 8.788 ± 0.038 |
Met |
Asn |
Gln |
Pro |
Arg |
Ser |
Thr |
Val |
Trp |
Tyr |
|---|---|---|---|---|---|---|---|---|---|
2.99 ± 0.018 | 4.513 ± 0.027 |
2.978 ± 0.024 | 3.469 ± 0.023 |
4.433 ± 0.028 | 6.048 ± 0.032 |
5.017 ± 0.028 | 6.529 ± 0.031 |
0.96 ± 0.012 | 4.426 ± 0.025 |
Most of the basic statistics you can see at this page can be downloaded from this CSV file
Proteome-pI is available under Creative Commons Attribution-NoDerivs license, for more details see here
| Reference: Kozlowski LP. Proteome-pI 2.0: Proteome Isoelectric Point Database Update. Nucleic Acids Res. 2021, doi: 10.1093/nar/gkab944 | Contact: Lukasz P. Kozlowski |
