Firmicutes bacterium CAG:145
Taxonomy: cellular organisms; Bacteria; Terrabacteria group; Firmicutes; environmental samples
Average proteome isoelectric point is 6.09
Get precalculated fractions of proteins

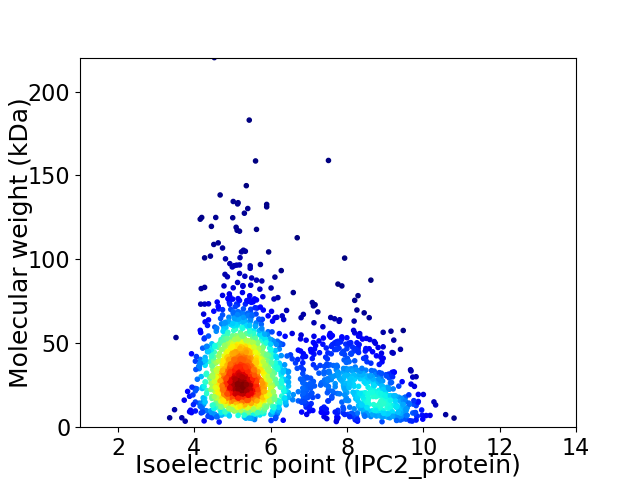
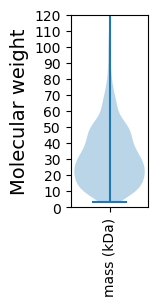
Virtual 2D-PAGE plot for 1960 proteins (isoelectric point calculated using IPC2_protein)
Get csv file with sequences according to given criteria:
* You can choose from 21 different methods for calculating isoelectric point
Summary statistics related to proteome-wise predictions


Protein with the lowest isoelectric point:
>tr|R6END9|R6END9_9FIRM Glycosyltransferase group 1 family protein OS=Firmicutes bacterium CAG:145 OX=1263005 GN=BN497_01522 PE=4 SV=1
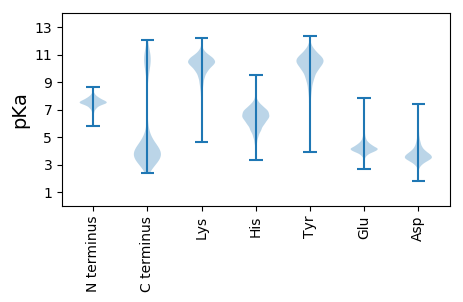
MM1 pKa = 7.24NRR3 pKa = 11.84EE4 pKa = 3.7QLYY7 pKa = 10.21EE8 pKa = 4.04YY9 pKa = 11.06LDD11 pKa = 3.72IDD13 pKa = 3.85TPADD17 pKa = 3.44FEE19 pKa = 4.59YY20 pKa = 10.43FEE22 pKa = 4.94NMAALLEE29 pKa = 4.35CEE31 pKa = 3.67EE32 pKa = 5.19DD33 pKa = 3.2IPYY36 pKa = 10.94EE37 pKa = 4.08EE38 pKa = 4.25VCALIEE44 pKa = 5.75DD45 pKa = 3.84VDD47 pKa = 4.04KK48 pKa = 11.74DD49 pKa = 3.98NLAMLIDD56 pKa = 4.0NYY58 pKa = 10.73FEE60 pKa = 4.33EE61 pKa = 5.98LSDD64 pKa = 4.32FYY66 pKa = 11.02PDD68 pKa = 4.24GDD70 pKa = 4.1DD71 pKa = 3.47EE72 pKa = 6.63FYY74 pKa = 11.09MLMDD78 pKa = 5.6KK79 pKa = 10.54IRR81 pKa = 11.84LSLSGMAKK89 pKa = 10.34NSGEE93 pKa = 4.31KK94 pKa = 9.09NTMASLAEE102 pKa = 3.97EE103 pKa = 4.5LCRR106 pKa = 11.84FRR108 pKa = 11.84KK109 pKa = 9.13WYY111 pKa = 9.95SLEE114 pKa = 4.15SEE116 pKa = 4.81VVCVSVSEE124 pKa = 4.3GEE126 pKa = 4.15EE127 pKa = 3.78RR128 pKa = 11.84AEE130 pKa = 4.13TLRR133 pKa = 11.84DD134 pKa = 3.46ALVLSRR140 pKa = 11.84LEE142 pKa = 4.09KK143 pKa = 10.64LDD145 pKa = 3.61GEE147 pKa = 4.25KK148 pKa = 10.24FYY150 pKa = 11.52YY151 pKa = 10.5DD152 pKa = 4.0FSSCKK157 pKa = 10.15GYY159 pKa = 10.84EE160 pKa = 3.62IDD162 pKa = 4.9DD163 pKa = 3.93YY164 pKa = 11.28MMSFADD170 pKa = 4.35VIAACEE176 pKa = 4.09EE177 pKa = 4.39DD178 pKa = 5.79DD179 pKa = 4.48EE180 pKa = 4.93TPQQ183 pKa = 4.18
MM1 pKa = 7.24NRR3 pKa = 11.84EE4 pKa = 3.7QLYY7 pKa = 10.21EE8 pKa = 4.04YY9 pKa = 11.06LDD11 pKa = 3.72IDD13 pKa = 3.85TPADD17 pKa = 3.44FEE19 pKa = 4.59YY20 pKa = 10.43FEE22 pKa = 4.94NMAALLEE29 pKa = 4.35CEE31 pKa = 3.67EE32 pKa = 5.19DD33 pKa = 3.2IPYY36 pKa = 10.94EE37 pKa = 4.08EE38 pKa = 4.25VCALIEE44 pKa = 5.75DD45 pKa = 3.84VDD47 pKa = 4.04KK48 pKa = 11.74DD49 pKa = 3.98NLAMLIDD56 pKa = 4.0NYY58 pKa = 10.73FEE60 pKa = 4.33EE61 pKa = 5.98LSDD64 pKa = 4.32FYY66 pKa = 11.02PDD68 pKa = 4.24GDD70 pKa = 4.1DD71 pKa = 3.47EE72 pKa = 6.63FYY74 pKa = 11.09MLMDD78 pKa = 5.6KK79 pKa = 10.54IRR81 pKa = 11.84LSLSGMAKK89 pKa = 10.34NSGEE93 pKa = 4.31KK94 pKa = 9.09NTMASLAEE102 pKa = 3.97EE103 pKa = 4.5LCRR106 pKa = 11.84FRR108 pKa = 11.84KK109 pKa = 9.13WYY111 pKa = 9.95SLEE114 pKa = 4.15SEE116 pKa = 4.81VVCVSVSEE124 pKa = 4.3GEE126 pKa = 4.15EE127 pKa = 3.78RR128 pKa = 11.84AEE130 pKa = 4.13TLRR133 pKa = 11.84DD134 pKa = 3.46ALVLSRR140 pKa = 11.84LEE142 pKa = 4.09KK143 pKa = 10.64LDD145 pKa = 3.61GEE147 pKa = 4.25KK148 pKa = 10.24FYY150 pKa = 11.52YY151 pKa = 10.5DD152 pKa = 4.0FSSCKK157 pKa = 10.15GYY159 pKa = 10.84EE160 pKa = 3.62IDD162 pKa = 4.9DD163 pKa = 3.93YY164 pKa = 11.28MMSFADD170 pKa = 4.35VIAACEE176 pKa = 4.09EE177 pKa = 4.39DD178 pKa = 5.79DD179 pKa = 4.48EE180 pKa = 4.93TPQQ183 pKa = 4.18
Molecular weight: 21.3 kDa
Isoelectric point according different methods:
Protein with the highest isoelectric point:
>tr|R6EZZ6|R6EZZ6_9FIRM Branched-chain amino acid ABC transporter permease protein OS=Firmicutes bacterium CAG:145 OX=1263005 GN=BN497_00359 PE=4 SV=1
MM1 pKa = 7.83AKK3 pKa = 9.58TSLKK7 pKa = 10.48VKK9 pKa = 7.55QQRR12 pKa = 11.84KK13 pKa = 7.82PKK15 pKa = 9.16YY16 pKa = 7.19STRR19 pKa = 11.84AYY21 pKa = 8.48TRR23 pKa = 11.84CRR25 pKa = 11.84LCGRR29 pKa = 11.84PHH31 pKa = 6.58AVLRR35 pKa = 11.84KK36 pKa = 9.63YY37 pKa = 9.83GICRR41 pKa = 11.84ICFRR45 pKa = 11.84EE46 pKa = 3.81LAYY49 pKa = 10.0KK50 pKa = 10.86GEE52 pKa = 4.16IPGVRR57 pKa = 11.84KK58 pKa = 10.13ASWW61 pKa = 2.78
MM1 pKa = 7.83AKK3 pKa = 9.58TSLKK7 pKa = 10.48VKK9 pKa = 7.55QQRR12 pKa = 11.84KK13 pKa = 7.82PKK15 pKa = 9.16YY16 pKa = 7.19STRR19 pKa = 11.84AYY21 pKa = 8.48TRR23 pKa = 11.84CRR25 pKa = 11.84LCGRR29 pKa = 11.84PHH31 pKa = 6.58AVLRR35 pKa = 11.84KK36 pKa = 9.63YY37 pKa = 9.83GICRR41 pKa = 11.84ICFRR45 pKa = 11.84EE46 pKa = 3.81LAYY49 pKa = 10.0KK50 pKa = 10.86GEE52 pKa = 4.16IPGVRR57 pKa = 11.84KK58 pKa = 10.13ASWW61 pKa = 2.78
Molecular weight: 7.16 kDa
Isoelectric point according different methods:
Peptides (in silico digests for buttom-up proteomics)
Below you can find in silico digests of the whole proteome with Trypsin, Chymotrypsin, Trypsin+LysC, LysN, ArgC proteases suitable for different mass spec machines.| Try ESI |
 |
|---|
| ChTry ESI |
 |
|---|
| ArgC ESI |
 |
|---|
| LysN ESI |
 |
|---|
| TryLysC ESI |
 |
|---|
| Try MALDI |
 |
|---|
| ChTry MALDI |
 |
|---|
| ArgC MALDI |
 |
|---|
| LysN MALDI |
 |
|---|
| TryLysC MALDI |
 |
|---|
| Try LTQ |
 |
|---|
| ChTry LTQ |
 |
|---|
| ArgC LTQ |
 |
|---|
| LysN LTQ |
 |
|---|
| TryLysC LTQ |
 |
|---|
| Try MSlow |
 |
|---|
| ChTry MSlow |
 |
|---|
| ArgC MSlow |
 |
|---|
| LysN MSlow |
 |
|---|
| TryLysC MSlow |
 |
|---|
| Try MShigh |
 |
|---|
| ChTry MShigh |
 |
|---|
| ArgC MShigh |
 |
|---|
| LysN MShigh |
 |
|---|
| TryLysC MShigh |
 |
|---|
General Statistics
Number of major isoforms |
Number of additional isoforms |
Number of all proteins |
Number of amino acids |
Min. Seq. Length |
Max. Seq. Length |
Avg. Seq. Length |
Avg. Mol. Weight |
|---|---|---|---|---|---|---|---|
0 |
592543 |
29 |
1997 |
302.3 |
33.66 |
Amino acid frequency
Ala |
Cys |
Asp |
Glu |
Phe |
Gly |
His |
Ile |
Lys |
Leu |
|---|---|---|---|---|---|---|---|---|---|
7.962 ± 0.053 | 1.517 ± 0.027 |
5.939 ± 0.045 | 7.52 ± 0.058 |
4.11 ± 0.033 | 7.67 ± 0.054 |
1.489 ± 0.022 | 8.005 ± 0.047 |
6.972 ± 0.043 | 8.524 ± 0.045 |
Met |
Asn |
Gln |
Pro |
Arg |
Ser |
Thr |
Val |
Trp |
Tyr |
|---|---|---|---|---|---|---|---|---|---|
3.262 ± 0.029 | 3.902 ± 0.03 |
3.292 ± 0.025 | 2.695 ± 0.027 |
4.617 ± 0.046 | 5.996 ± 0.053 |
5.147 ± 0.037 | 6.817 ± 0.044 |
0.785 ± 0.017 | 3.776 ± 0.04 |
Most of the basic statistics you can see at this page can be downloaded from this CSV file
Proteome-pI is available under Creative Commons Attribution-NoDerivs license, for more details see here
| Reference: Kozlowski LP. Proteome-pI 2.0: Proteome Isoelectric Point Database Update. Nucleic Acids Res. 2021, doi: 10.1093/nar/gkab944 | Contact: Lukasz P. Kozlowski |
