Torrubiella hemipterigena
Taxonomy: cellular organisms; Eukaryota; Opisthokonta; Fungi; Dikarya; Ascomycota; saccharomyceta; Pezizomycotina; leotiomyceta; sordariomyceta; Sordariomycetes; Hypocreomycetidae; Hypocreales; Clavicipitaceae; Torrubiella
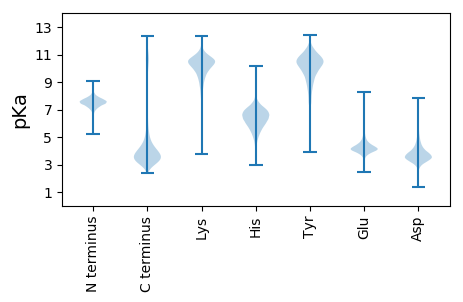
Average proteome isoelectric point is 6.37
Get precalculated fractions of proteins

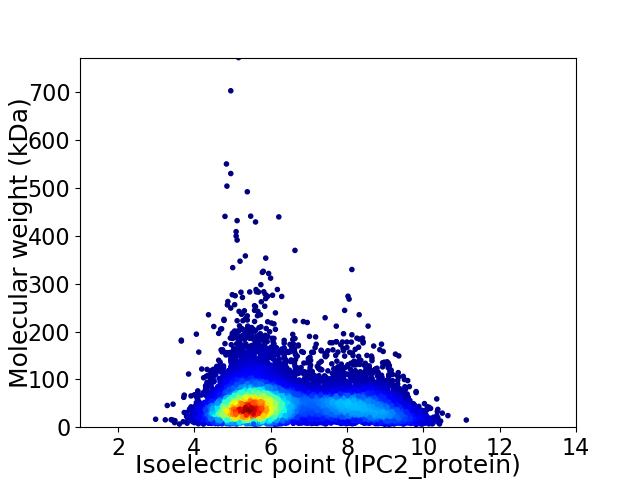
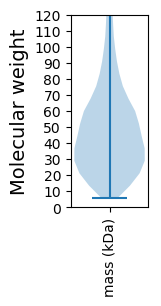
Virtual 2D-PAGE plot for 11466 proteins (isoelectric point calculated using IPC2_protein)
Get csv file with sequences according to given criteria:
* You can choose from 21 different methods for calculating isoelectric point
Summary statistics related to proteome-wise predictions


Protein with the lowest isoelectric point:
>tr|A0A0A1T6B4|A0A0A1T6B4_9HYPO Uncharacterized protein OS=Torrubiella hemipterigena OX=1531966 GN=VHEMI01956 PE=4 SV=1
MM1 pKa = 7.83PSWQDD6 pKa = 3.34LPTVRR11 pKa = 11.84SDD13 pKa = 4.6DD14 pKa = 4.66DD15 pKa = 3.5TDD17 pKa = 3.68QDD19 pKa = 3.93VNAVDD24 pKa = 4.39NRR26 pKa = 11.84AQFPIEE32 pKa = 4.15TFGPDD37 pKa = 3.05NTGGISNDD45 pKa = 3.05LTVFSAHH52 pKa = 6.46VDD54 pKa = 3.93FDD56 pKa = 4.44LDD58 pKa = 3.57ATHH61 pKa = 7.37LEE63 pKa = 4.09FLGPEE68 pKa = 4.09FVVVEE73 pKa = 4.21MPDD76 pKa = 3.69YY77 pKa = 10.73PPHH80 pKa = 6.12QDD82 pKa = 2.37GRR84 pKa = 11.84YY85 pKa = 7.19YY86 pKa = 10.93CRR88 pKa = 11.84DD89 pKa = 3.54AEE91 pKa = 4.36CDD93 pKa = 3.54PRR95 pKa = 11.84PSFTTGSALKK105 pKa = 10.53YY106 pKa = 8.76YY107 pKa = 10.6DD108 pKa = 4.69PYY110 pKa = 11.88SPMM113 pKa = 4.38
MM1 pKa = 7.83PSWQDD6 pKa = 3.34LPTVRR11 pKa = 11.84SDD13 pKa = 4.6DD14 pKa = 4.66DD15 pKa = 3.5TDD17 pKa = 3.68QDD19 pKa = 3.93VNAVDD24 pKa = 4.39NRR26 pKa = 11.84AQFPIEE32 pKa = 4.15TFGPDD37 pKa = 3.05NTGGISNDD45 pKa = 3.05LTVFSAHH52 pKa = 6.46VDD54 pKa = 3.93FDD56 pKa = 4.44LDD58 pKa = 3.57ATHH61 pKa = 7.37LEE63 pKa = 4.09FLGPEE68 pKa = 4.09FVVVEE73 pKa = 4.21MPDD76 pKa = 3.69YY77 pKa = 10.73PPHH80 pKa = 6.12QDD82 pKa = 2.37GRR84 pKa = 11.84YY85 pKa = 7.19YY86 pKa = 10.93CRR88 pKa = 11.84DD89 pKa = 3.54AEE91 pKa = 4.36CDD93 pKa = 3.54PRR95 pKa = 11.84PSFTTGSALKK105 pKa = 10.53YY106 pKa = 8.76YY107 pKa = 10.6DD108 pKa = 4.69PYY110 pKa = 11.88SPMM113 pKa = 4.38
Molecular weight: 12.76 kDa
Isoelectric point according different methods:
Protein with the highest isoelectric point:
>tr|A0A0A1T084|A0A0A1T084_9HYPO FAD-binding PCMH-type domain-containing protein OS=Torrubiella hemipterigena OX=1531966 GN=VHEMI04053 PE=3 SV=1
MM1 pKa = 7.67HH2 pKa = 7.42ATQLHH7 pKa = 6.05KK8 pKa = 10.36MQALTRR14 pKa = 11.84AARR17 pKa = 11.84PVLRR21 pKa = 11.84TTLPIRR27 pKa = 11.84TFTTMTTPIRR37 pKa = 11.84PSLSASAIRR46 pKa = 11.84RR47 pKa = 11.84PTSLLPSLLTPPPATTTAAAADD69 pKa = 4.03VVSTSAISAHH79 pKa = 6.47PAFAGAQMRR88 pKa = 11.84FGPRR92 pKa = 11.84NTMTGATRR100 pKa = 11.84LVQKK104 pKa = 10.08RR105 pKa = 11.84RR106 pKa = 11.84HH107 pKa = 4.96GFLYY111 pKa = 10.42RR112 pKa = 11.84MRR114 pKa = 11.84SRR116 pKa = 11.84TGRR119 pKa = 11.84KK120 pKa = 8.73IILRR124 pKa = 11.84RR125 pKa = 11.84KK126 pKa = 7.15TKK128 pKa = 9.84GRR130 pKa = 11.84RR131 pKa = 11.84HH132 pKa = 5.06VAWW135 pKa = 4.03
MM1 pKa = 7.67HH2 pKa = 7.42ATQLHH7 pKa = 6.05KK8 pKa = 10.36MQALTRR14 pKa = 11.84AARR17 pKa = 11.84PVLRR21 pKa = 11.84TTLPIRR27 pKa = 11.84TFTTMTTPIRR37 pKa = 11.84PSLSASAIRR46 pKa = 11.84RR47 pKa = 11.84PTSLLPSLLTPPPATTTAAAADD69 pKa = 4.03VVSTSAISAHH79 pKa = 6.47PAFAGAQMRR88 pKa = 11.84FGPRR92 pKa = 11.84NTMTGATRR100 pKa = 11.84LVQKK104 pKa = 10.08RR105 pKa = 11.84RR106 pKa = 11.84HH107 pKa = 4.96GFLYY111 pKa = 10.42RR112 pKa = 11.84MRR114 pKa = 11.84SRR116 pKa = 11.84TGRR119 pKa = 11.84KK120 pKa = 8.73IILRR124 pKa = 11.84RR125 pKa = 11.84KK126 pKa = 7.15TKK128 pKa = 9.84GRR130 pKa = 11.84RR131 pKa = 11.84HH132 pKa = 5.06VAWW135 pKa = 4.03
Molecular weight: 14.96 kDa
Isoelectric point according different methods:
Peptides (in silico digests for buttom-up proteomics)
Below you can find in silico digests of the whole proteome with Trypsin, Chymotrypsin, Trypsin+LysC, LysN, ArgC proteases suitable for different mass spec machines.| Try ESI |
 |
|---|
| ChTry ESI |
 |
|---|
| ArgC ESI |
 |
|---|
| LysN ESI |
 |
|---|
| TryLysC ESI |
 |
|---|
| Try MALDI |
 |
|---|
| ChTry MALDI |
 |
|---|
| ArgC MALDI |
 |
|---|
| LysN MALDI |
 |
|---|
| TryLysC MALDI |
 |
|---|
| Try LTQ |
 |
|---|
| ChTry LTQ |
 |
|---|
| ArgC LTQ |
 |
|---|
| LysN LTQ |
 |
|---|
| TryLysC LTQ |
 |
|---|
| Try MSlow |
 |
|---|
| ChTry MSlow |
 |
|---|
| ArgC MSlow |
 |
|---|
| LysN MSlow |
 |
|---|
| TryLysC MSlow |
 |
|---|
| Try MShigh |
 |
|---|
| ChTry MShigh |
 |
|---|
| ArgC MShigh |
 |
|---|
| LysN MShigh |
 |
|---|
| TryLysC MShigh |
 |
|---|
General Statistics
Number of major isoforms |
Number of additional isoforms |
Number of all proteins |
Number of amino acids |
Min. Seq. Length |
Max. Seq. Length |
Avg. Seq. Length |
Avg. Mol. Weight |
|---|---|---|---|---|---|---|---|
5553574 |
50 |
7027 |
484.4 |
53.49 |
Amino acid frequency
Ala |
Cys |
Asp |
Glu |
Phe |
Gly |
His |
Ile |
Lys |
Leu |
|---|---|---|---|---|---|---|---|---|---|
9.158 ± 0.022 | 1.274 ± 0.009 |
5.903 ± 0.018 | 5.828 ± 0.022 |
3.749 ± 0.013 | 6.742 ± 0.02 |
2.318 ± 0.01 | 5.097 ± 0.014 |
5.003 ± 0.018 | 8.82 ± 0.024 |
Met |
Asn |
Gln |
Pro |
Arg |
Ser |
Thr |
Val |
Trp |
Tyr |
|---|---|---|---|---|---|---|---|---|---|
2.349 ± 0.009 | 3.831 ± 0.011 |
5.717 ± 0.023 | 4.037 ± 0.016 |
5.676 ± 0.018 | 8.028 ± 0.025 |
6.082 ± 0.015 | 6.127 ± 0.016 |
1.455 ± 0.007 | 2.808 ± 0.011 |
Most of the basic statistics you can see at this page can be downloaded from this CSV file
Proteome-pI is available under Creative Commons Attribution-NoDerivs license, for more details see here
| Reference: Kozlowski LP. Proteome-pI 2.0: Proteome Isoelectric Point Database Update. Nucleic Acids Res. 2021, doi: 10.1093/nar/gkab944 | Contact: Lukasz P. Kozlowski |
