Ralstonia phage RS611
Taxonomy: Viruses; Monodnaviria; Loebvirae; Hofneiviricota; Faserviricetes; Tubulavirales; Inoviridae; Restivirus; Ralstonia virus RSS1
Average proteome isoelectric point is 7.48
Get precalculated fractions of proteins
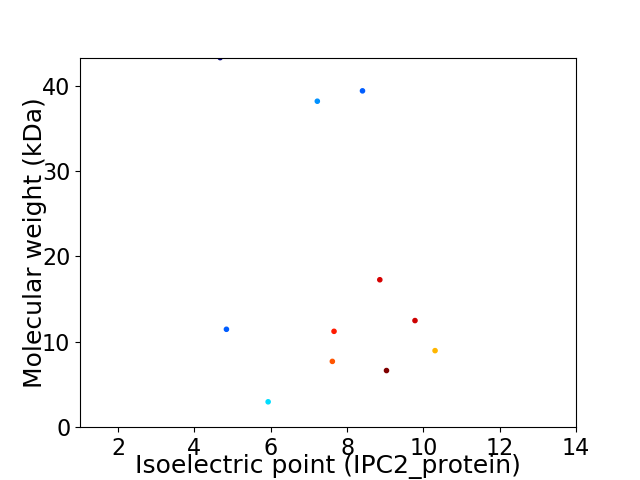
Virtual 2D-PAGE plot for 11 proteins (isoelectric point calculated using IPC2_protein)
Get csv file with sequences according to given criteria:
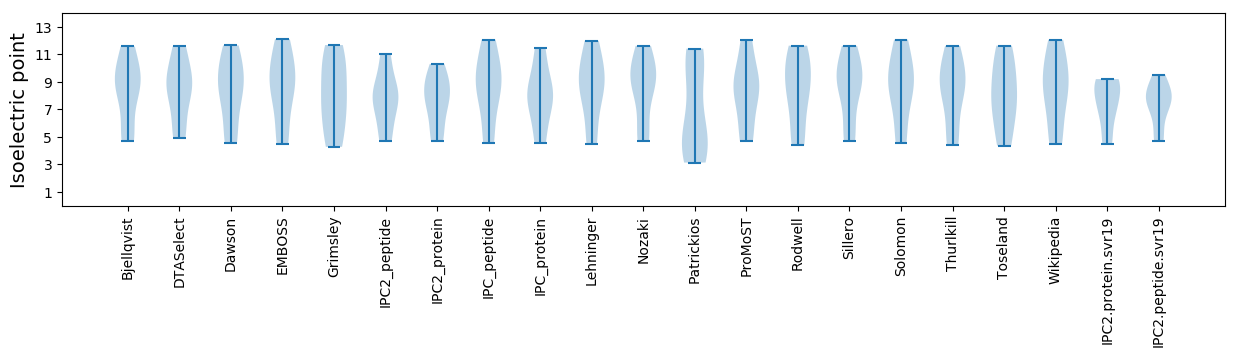
* You can choose from 21 different methods for calculating isoelectric point
Summary statistics related to proteome-wise predictions


Protein with the lowest isoelectric point:
>tr|A0A097ZPJ5|A0A097ZPJ5_9VIRU Uncharacterized protein OS=Ralstonia phage RS611 OX=1497850 PE=4 SV=1
MM1 pKa = 7.59RR2 pKa = 11.84VLVLLLCWWASSAWASTIPLIPPPNIVLTGTGYY35 pKa = 8.68VTTGAVTLSEE45 pKa = 4.26VATATEE51 pKa = 3.73MRR53 pKa = 11.84AAVGAGAATIAATMTVGEE71 pKa = 4.37GAAAVALAALRR82 pKa = 11.84ATPAIATATSLAYY95 pKa = 10.22LAQLGIQKK103 pKa = 10.22CLDD106 pKa = 3.79GTWCTSKK113 pKa = 10.67RR114 pKa = 11.84SPAAGDD120 pKa = 3.22TGFNGWGWNYY130 pKa = 10.81SYY132 pKa = 10.01NTSATGGNIANGVAASPGAACSAMLAADD160 pKa = 5.01AYY162 pKa = 11.27LAGQKK167 pKa = 10.68AKK169 pKa = 10.24FAGMKK174 pKa = 9.0ATGNGTSYY182 pKa = 10.51EE183 pKa = 4.07CHH185 pKa = 5.33YY186 pKa = 10.2TNDD189 pKa = 3.75GGDD192 pKa = 3.15NFYY195 pKa = 11.16AGTSQASSCVDD206 pKa = 3.64GYY208 pKa = 10.97VVSGSACVPDD218 pKa = 3.98PAGPTVGASDD228 pKa = 4.38ADD230 pKa = 3.82WNKK233 pKa = 10.46GLTYY237 pKa = 9.63PLPAGVASDD246 pKa = 3.39MAAAKK251 pKa = 10.52VPIPVKK257 pKa = 9.49LTPSTTPVNVNLSDD271 pKa = 4.25PYY273 pKa = 11.06VDD275 pKa = 3.41PVTGKK280 pKa = 10.3RR281 pKa = 11.84YY282 pKa = 9.86RR283 pKa = 11.84DD284 pKa = 3.59VATVTPNSDD293 pKa = 2.78GKK295 pKa = 8.9TATLTTAKK303 pKa = 10.4QEE305 pKa = 3.7VDD307 pKa = 3.33ANGNPVTDD315 pKa = 4.0PATGNGKK322 pKa = 9.89APEE325 pKa = 4.29KK326 pKa = 10.6QDD328 pKa = 3.76DD329 pKa = 3.81QCSGHH334 pKa = 5.4EE335 pKa = 4.06TRR337 pKa = 11.84MGCIEE342 pKa = 4.1QGEE345 pKa = 4.53IPDD348 pKa = 4.33GPDD351 pKa = 3.42LKK353 pKa = 10.65EE354 pKa = 3.58QQVNVKK360 pKa = 7.96VTPDD364 pKa = 3.69SGWGADD370 pKa = 3.69TAPCPSDD377 pKa = 3.24LTASIHH383 pKa = 5.69GMPISWSLKK392 pKa = 8.3PVCDD396 pKa = 3.58GADD399 pKa = 3.03MFRR402 pKa = 11.84PVIIACAWLGAALIVIGVGRR422 pKa = 11.84KK423 pKa = 9.67GEE425 pKa = 4.05EE426 pKa = 3.72
MM1 pKa = 7.59RR2 pKa = 11.84VLVLLLCWWASSAWASTIPLIPPPNIVLTGTGYY35 pKa = 8.68VTTGAVTLSEE45 pKa = 4.26VATATEE51 pKa = 3.73MRR53 pKa = 11.84AAVGAGAATIAATMTVGEE71 pKa = 4.37GAAAVALAALRR82 pKa = 11.84ATPAIATATSLAYY95 pKa = 10.22LAQLGIQKK103 pKa = 10.22CLDD106 pKa = 3.79GTWCTSKK113 pKa = 10.67RR114 pKa = 11.84SPAAGDD120 pKa = 3.22TGFNGWGWNYY130 pKa = 10.81SYY132 pKa = 10.01NTSATGGNIANGVAASPGAACSAMLAADD160 pKa = 5.01AYY162 pKa = 11.27LAGQKK167 pKa = 10.68AKK169 pKa = 10.24FAGMKK174 pKa = 9.0ATGNGTSYY182 pKa = 10.51EE183 pKa = 4.07CHH185 pKa = 5.33YY186 pKa = 10.2TNDD189 pKa = 3.75GGDD192 pKa = 3.15NFYY195 pKa = 11.16AGTSQASSCVDD206 pKa = 3.64GYY208 pKa = 10.97VVSGSACVPDD218 pKa = 3.98PAGPTVGASDD228 pKa = 4.38ADD230 pKa = 3.82WNKK233 pKa = 10.46GLTYY237 pKa = 9.63PLPAGVASDD246 pKa = 3.39MAAAKK251 pKa = 10.52VPIPVKK257 pKa = 9.49LTPSTTPVNVNLSDD271 pKa = 4.25PYY273 pKa = 11.06VDD275 pKa = 3.41PVTGKK280 pKa = 10.3RR281 pKa = 11.84YY282 pKa = 9.86RR283 pKa = 11.84DD284 pKa = 3.59VATVTPNSDD293 pKa = 2.78GKK295 pKa = 8.9TATLTTAKK303 pKa = 10.4QEE305 pKa = 3.7VDD307 pKa = 3.33ANGNPVTDD315 pKa = 4.0PATGNGKK322 pKa = 9.89APEE325 pKa = 4.29KK326 pKa = 10.6QDD328 pKa = 3.76DD329 pKa = 3.81QCSGHH334 pKa = 5.4EE335 pKa = 4.06TRR337 pKa = 11.84MGCIEE342 pKa = 4.1QGEE345 pKa = 4.53IPDD348 pKa = 4.33GPDD351 pKa = 3.42LKK353 pKa = 10.65EE354 pKa = 3.58QQVNVKK360 pKa = 7.96VTPDD364 pKa = 3.69SGWGADD370 pKa = 3.69TAPCPSDD377 pKa = 3.24LTASIHH383 pKa = 5.69GMPISWSLKK392 pKa = 8.3PVCDD396 pKa = 3.58GADD399 pKa = 3.03MFRR402 pKa = 11.84PVIIACAWLGAALIVIGVGRR422 pKa = 11.84KK423 pKa = 9.67GEE425 pKa = 4.05EE426 pKa = 3.72
Molecular weight: 43.27 kDa
Isoelectric point according different methods:
Protein with the highest isoelectric point:
>tr|A0A097ZPH8|A0A097ZPH8_9VIRU Zot domain-containing protein OS=Ralstonia phage RS611 OX=1497850 PE=4 SV=1
MM1 pKa = 7.49EE2 pKa = 5.02SSNRR6 pKa = 11.84EE7 pKa = 3.6PNMRR11 pKa = 11.84DD12 pKa = 2.85VTDD15 pKa = 3.74NVTVDD20 pKa = 3.88LPGMEE25 pKa = 4.42QKK27 pKa = 10.45RR28 pKa = 11.84GRR30 pKa = 11.84GRR32 pKa = 11.84PRR34 pKa = 11.84KK35 pKa = 9.12AHH37 pKa = 6.02AMTNAEE43 pKa = 3.67RR44 pKa = 11.84QAAYY48 pKa = 9.72RR49 pKa = 11.84ARR51 pKa = 11.84RR52 pKa = 11.84RR53 pKa = 11.84AQQPADD59 pKa = 3.6RR60 pKa = 11.84SVTVTKK66 pKa = 9.82MHH68 pKa = 6.73EE69 pKa = 4.26KK70 pKa = 8.24VTKK73 pKa = 9.17NRR75 pKa = 11.84KK76 pKa = 7.7AVRR79 pKa = 11.84IAGLFCVQRR88 pKa = 11.84RR89 pKa = 11.84EE90 pKa = 4.18CPRR93 pKa = 11.84LEE95 pKa = 4.0RR96 pKa = 11.84RR97 pKa = 11.84AEE99 pKa = 4.11GAPLGTWEE107 pKa = 4.11RR108 pKa = 3.89
MM1 pKa = 7.49EE2 pKa = 5.02SSNRR6 pKa = 11.84EE7 pKa = 3.6PNMRR11 pKa = 11.84DD12 pKa = 2.85VTDD15 pKa = 3.74NVTVDD20 pKa = 3.88LPGMEE25 pKa = 4.42QKK27 pKa = 10.45RR28 pKa = 11.84GRR30 pKa = 11.84GRR32 pKa = 11.84PRR34 pKa = 11.84KK35 pKa = 9.12AHH37 pKa = 6.02AMTNAEE43 pKa = 3.67RR44 pKa = 11.84QAAYY48 pKa = 9.72RR49 pKa = 11.84ARR51 pKa = 11.84RR52 pKa = 11.84RR53 pKa = 11.84AQQPADD59 pKa = 3.6RR60 pKa = 11.84SVTVTKK66 pKa = 9.82MHH68 pKa = 6.73EE69 pKa = 4.26KK70 pKa = 8.24VTKK73 pKa = 9.17NRR75 pKa = 11.84KK76 pKa = 7.7AVRR79 pKa = 11.84IAGLFCVQRR88 pKa = 11.84RR89 pKa = 11.84EE90 pKa = 4.18CPRR93 pKa = 11.84LEE95 pKa = 4.0RR96 pKa = 11.84RR97 pKa = 11.84AEE99 pKa = 4.11GAPLGTWEE107 pKa = 4.11RR108 pKa = 3.89
Molecular weight: 12.48 kDa
Isoelectric point according different methods:
Peptides (in silico digests for buttom-up proteomics)
Below you can find in silico digests of the whole proteome with Trypsin, Chymotrypsin, Trypsin+LysC, LysN, ArgC proteases suitable for different mass spec machines.| Try ESI |
 |
|---|
| ChTry ESI |
|
|---|
| ArgC ESI |
|
|---|
| LysN ESI |
|
|---|
| TryLysC ESI |
|
|---|
| Try MALDI |
|
|---|
| ChTry MALDI |
|
|---|
| ArgC MALDI |
|
|---|
| LysN MALDI |
|
|---|
| TryLysC MALDI |
|
|---|
| Try LTQ |
|
|---|
| ChTry LTQ |
|
|---|
| ArgC LTQ |
|
|---|
| LysN LTQ |
|
|---|
| TryLysC LTQ |
|
|---|
| Try MSlow |
|
|---|
| ChTry MSlow |
|
|---|
| ArgC MSlow |
|
|---|
| LysN MSlow |
|
|---|
| TryLysC MSlow |
|
|---|
| Try MShigh |
|
|---|
| ChTry MShigh |
|
|---|
| ArgC MShigh |
|
|---|
| LysN MShigh |
|
|---|
| TryLysC MShigh |
|
|---|
General Statistics
Number of major isoforms |
Number of additional isoforms |
Number of all proteins |
Number of amino acids |
Min. Seq. Length |
Max. Seq. Length |
Avg. Seq. Length |
Avg. Mol. Weight |
|---|---|---|---|---|---|---|---|
0 |
1862 |
26 |
426 |
169.3 |
18.14 |
Amino acid frequency
Ala |
Cys |
Asp |
Glu |
Phe |
Gly |
His |
Ile |
Lys |
Leu |
|---|---|---|---|---|---|---|---|---|---|
13.641 ± 0.988 | 1.933 ± 0.256 |
4.78 ± 0.58 | 4.565 ± 0.764 |
2.632 ± 0.501 | 8.647 ± 0.966 |
1.504 ± 0.324 | 4.511 ± 0.464 |
4.834 ± 0.516 | 7.948 ± 0.936 |
Met |
Asn |
Gln |
Pro |
Arg |
Ser |
Thr |
Val |
Trp |
Tyr |
|---|---|---|---|---|---|---|---|---|---|
3.222 ± 0.396 | 2.309 ± 0.506 |
6.069 ± 0.856 | 3.598 ± 0.458 |
6.069 ± 1.181 | 5.371 ± 0.507 |
7.143 ± 0.704 | 7.197 ± 0.436 |
1.504 ± 0.279 | 2.524 ± 0.305 |
Most of the basic statistics you can see at this page can be downloaded from this CSV file
See this proteome in:

Proteome-pI is available under Creative Commons Attribution-NoDerivs license, for more details see here
| Reference: Kozlowski LP. Proteome-pI 2.0: Proteome Isoelectric Point Database Update. Nucleic Acids Res. 2021, doi: 10.1093/nar/gkab944 | Contact: Lukasz P. Kozlowski |