Propionibacterium phage P1.1
Taxonomy: Viruses; Duplodnaviria; Heunggongvirae; Uroviricota; Caudoviricetes; Caudovirales; Siphoviridae; Pahexavirus; Propionibacterium virus P1.1
Average proteome isoelectric point is 6.26
Get precalculated fractions of proteins

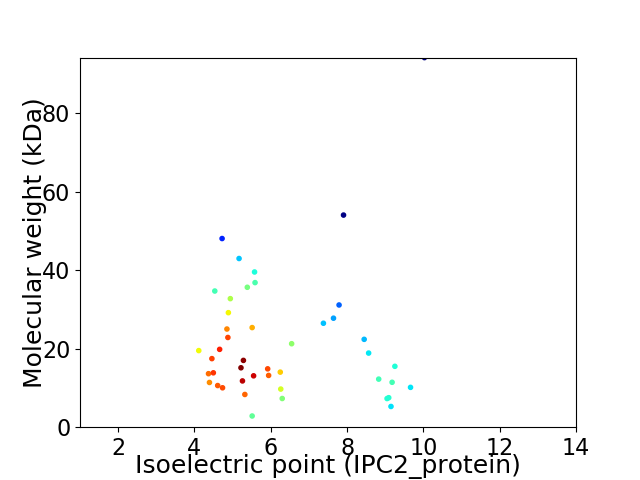
Virtual 2D-PAGE plot for 45 proteins (isoelectric point calculated using IPC2_protein)
Get csv file with sequences according to given criteria:
* You can choose from 21 different methods for calculating isoelectric point
Summary statistics related to proteome-wise predictions


Protein with the lowest isoelectric point:
>tr|K4HNN5|K4HNN5_9CAUD Helix-turn-helix DNA-binding protein OS=Propionibacterium phage P1.1 OX=1229792 GN=27 PE=4 SV=1
MM1 pKa = 7.49NNTHH5 pKa = 6.9NITYY9 pKa = 7.31TTLNTAIHH17 pKa = 7.0RR18 pKa = 11.84IVQQQPTNMQQLEE31 pKa = 4.44NIVDD35 pKa = 4.0SVEE38 pKa = 3.94NQYY41 pKa = 10.93GVPISLDD48 pKa = 3.46NVNLTVNEE56 pKa = 3.98VSLDD60 pKa = 3.74DD61 pKa = 4.84LAIDD65 pKa = 4.03QDD67 pKa = 4.19TLDD70 pKa = 4.0EE71 pKa = 4.48CSEE74 pKa = 4.13ILWLCDD80 pKa = 3.46STGHH84 pKa = 6.22PTNNSNTRR92 pKa = 11.84DD93 pKa = 3.59NSEE96 pKa = 4.05DD97 pKa = 3.4QSPYY101 pKa = 11.08ASQEE105 pKa = 3.89ALDD108 pKa = 3.92WLAGIAYY115 pKa = 8.03QAKK118 pKa = 9.8LLQAAADD125 pKa = 4.37EE126 pKa = 4.43IRR128 pKa = 11.84WAIIRR133 pKa = 11.84HH134 pKa = 5.92CDD136 pKa = 2.84NHH138 pKa = 7.05KK139 pKa = 10.93NVIGRR144 pKa = 11.84NVLDD148 pKa = 3.77QASDD152 pKa = 3.81TISTCLHH159 pKa = 7.12LYY161 pKa = 10.6QMLEE165 pKa = 3.9DD166 pKa = 4.09TIDD169 pKa = 3.64RR170 pKa = 11.84NEE172 pKa = 3.83SS173 pKa = 3.04
MM1 pKa = 7.49NNTHH5 pKa = 6.9NITYY9 pKa = 7.31TTLNTAIHH17 pKa = 7.0RR18 pKa = 11.84IVQQQPTNMQQLEE31 pKa = 4.44NIVDD35 pKa = 4.0SVEE38 pKa = 3.94NQYY41 pKa = 10.93GVPISLDD48 pKa = 3.46NVNLTVNEE56 pKa = 3.98VSLDD60 pKa = 3.74DD61 pKa = 4.84LAIDD65 pKa = 4.03QDD67 pKa = 4.19TLDD70 pKa = 4.0EE71 pKa = 4.48CSEE74 pKa = 4.13ILWLCDD80 pKa = 3.46STGHH84 pKa = 6.22PTNNSNTRR92 pKa = 11.84DD93 pKa = 3.59NSEE96 pKa = 4.05DD97 pKa = 3.4QSPYY101 pKa = 11.08ASQEE105 pKa = 3.89ALDD108 pKa = 3.92WLAGIAYY115 pKa = 8.03QAKK118 pKa = 9.8LLQAAADD125 pKa = 4.37EE126 pKa = 4.43IRR128 pKa = 11.84WAIIRR133 pKa = 11.84HH134 pKa = 5.92CDD136 pKa = 2.84NHH138 pKa = 7.05KK139 pKa = 10.93NVIGRR144 pKa = 11.84NVLDD148 pKa = 3.77QASDD152 pKa = 3.81TISTCLHH159 pKa = 7.12LYY161 pKa = 10.6QMLEE165 pKa = 3.9DD166 pKa = 4.09TIDD169 pKa = 3.64RR170 pKa = 11.84NEE172 pKa = 3.83SS173 pKa = 3.04
Molecular weight: 19.51 kDa
Isoelectric point according different methods:
Protein with the highest isoelectric point:
>tr|K4HNY2|K4HNY2_9CAUD Scaffolding protein OS=Propionibacterium phage P1.1 OX=1229792 GN=5 PE=4 SV=1
MM1 pKa = 7.15MAHH4 pKa = 6.39TNRR7 pKa = 11.84TASASHH13 pKa = 5.86RR14 pKa = 11.84RR15 pKa = 11.84WRR17 pKa = 11.84QRR19 pKa = 11.84LITQARR25 pKa = 11.84QQGQTEE31 pKa = 4.38CPLCGATITWNTHH44 pKa = 5.99DD45 pKa = 5.37LPTSPEE51 pKa = 3.95ADD53 pKa = 3.64HH54 pKa = 6.3ITPVSRR60 pKa = 11.84GGLNTLDD67 pKa = 3.74NGQIICRR74 pKa = 11.84TCNRR78 pKa = 11.84SKK80 pKa = 11.33GNRR83 pKa = 11.84SEE85 pKa = 4.25PNIKK89 pKa = 9.81FQQQTTKK96 pKa = 10.53TLIPWW101 pKa = 3.75
MM1 pKa = 7.15MAHH4 pKa = 6.39TNRR7 pKa = 11.84TASASHH13 pKa = 5.86RR14 pKa = 11.84RR15 pKa = 11.84WRR17 pKa = 11.84QRR19 pKa = 11.84LITQARR25 pKa = 11.84QQGQTEE31 pKa = 4.38CPLCGATITWNTHH44 pKa = 5.99DD45 pKa = 5.37LPTSPEE51 pKa = 3.95ADD53 pKa = 3.64HH54 pKa = 6.3ITPVSRR60 pKa = 11.84GGLNTLDD67 pKa = 3.74NGQIICRR74 pKa = 11.84TCNRR78 pKa = 11.84SKK80 pKa = 11.33GNRR83 pKa = 11.84SEE85 pKa = 4.25PNIKK89 pKa = 9.81FQQQTTKK96 pKa = 10.53TLIPWW101 pKa = 3.75
Molecular weight: 11.44 kDa
Isoelectric point according different methods:
Peptides (in silico digests for buttom-up proteomics)
Below you can find in silico digests of the whole proteome with Trypsin, Chymotrypsin, Trypsin+LysC, LysN, ArgC proteases suitable for different mass spec machines.| Try ESI |
 |
|---|
| ChTry ESI |
 |
|---|
| ArgC ESI |
 |
|---|
| LysN ESI |
 |
|---|
| TryLysC ESI |
 |
|---|
| Try MALDI |
 |
|---|
| ChTry MALDI |
 |
|---|
| ArgC MALDI |
 |
|---|
| LysN MALDI |
 |
|---|
| TryLysC MALDI |
 |
|---|
| Try LTQ |
 |
|---|
| ChTry LTQ |
 |
|---|
| ArgC LTQ |
 |
|---|
| LysN LTQ |
 |
|---|
| TryLysC LTQ |
 |
|---|
| Try MSlow |
 |
|---|
| ChTry MSlow |
 |
|---|
| ArgC MSlow |
 |
|---|
| LysN MSlow |
 |
|---|
| TryLysC MSlow |
 |
|---|
| Try MShigh |
 |
|---|
| ChTry MShigh |
 |
|---|
| ArgC MShigh |
 |
|---|
| LysN MShigh |
 |
|---|
| TryLysC MShigh |
 |
|---|
General Statistics
Number of major isoforms |
Number of additional isoforms |
Number of all proteins |
Number of amino acids |
Min. Seq. Length |
Max. Seq. Length |
Avg. Seq. Length |
Avg. Mol. Weight |
|---|---|---|---|---|---|---|---|
0 |
8974 |
27 |
921 |
199.4 |
21.82 |
Amino acid frequency
Ala |
Cys |
Asp |
Glu |
Phe |
Gly |
His |
Ile |
Lys |
Leu |
|---|---|---|---|---|---|---|---|---|---|
9.94 ± 0.615 | 1.125 ± 0.18 |
6.53 ± 0.495 | 4.769 ± 0.44 |
2.808 ± 0.224 | 8.569 ± 0.56 |
2.574 ± 0.333 | 4.925 ± 0.395 |
4.056 ± 0.287 | 7.433 ± 0.261 |
Met |
Asn |
Gln |
Pro |
Arg |
Ser |
Thr |
Val |
Trp |
Tyr |
|---|---|---|---|---|---|---|---|---|---|
2.596 ± 0.301 | 3.778 ± 0.323 |
5.126 ± 0.323 | 4.435 ± 0.301 |
6.04 ± 0.394 | 6.619 ± 0.283 |
6.162 ± 0.436 | 7.778 ± 0.619 |
2.017 ± 0.214 | 2.719 ± 0.244 |
Most of the basic statistics you can see at this page can be downloaded from this CSV file
Proteome-pI is available under Creative Commons Attribution-NoDerivs license, for more details see here
| Reference: Kozlowski LP. Proteome-pI 2.0: Proteome Isoelectric Point Database Update. Nucleic Acids Res. 2021, doi: 10.1093/nar/gkab944 | Contact: Lukasz P. Kozlowski |
