Eimeria acervulina (Coccidian parasite)
Taxonomy: cellular organisms; Eukaryota; Sar; Alveolata; Apicomplexa; Conoidasida; Coccidia; Eucoccidiorida; Eimeriorina; Eimeriidae; Eimeria
Average proteome isoelectric point is 6.61
Get precalculated fractions of proteins

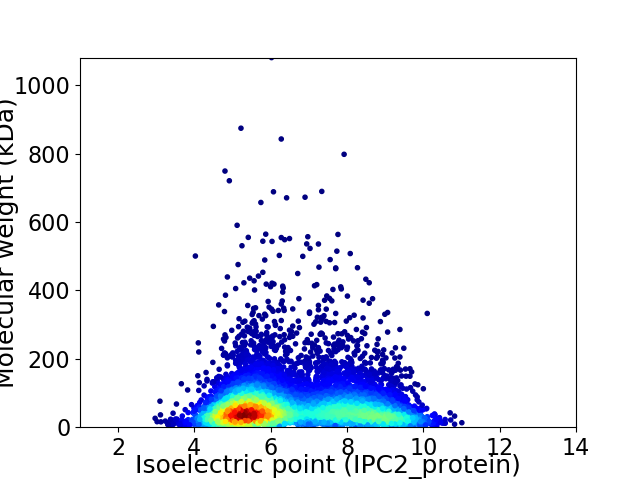
Virtual 2D-PAGE plot for 6867 proteins (isoelectric point calculated using IPC2_protein)
Get csv file with sequences according to given criteria:
* You can choose from 21 different methods for calculating isoelectric point
Summary statistics related to proteome-wise predictions


Protein with the lowest isoelectric point:
>tr|U6GJ12|U6GJ12_EIMAC Uncharacterized protein (Fragment) OS=Eimeria acervulina OX=5801 GN=EAH_00042010 PE=4 SV=1
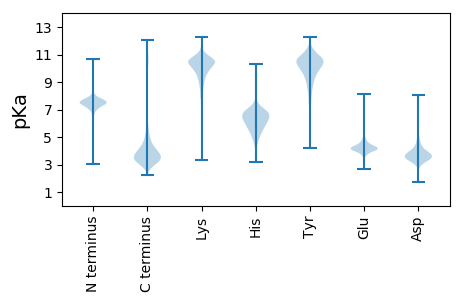
MM1 pKa = 7.67SEE3 pKa = 4.12SQQGGAYY10 pKa = 8.98SHH12 pKa = 7.36LYY14 pKa = 10.27KK15 pKa = 10.49IILVGDD21 pKa = 3.52ATVGKK26 pKa = 7.42THH28 pKa = 7.32LLSRR32 pKa = 11.84YY33 pKa = 7.01TRR35 pKa = 11.84GSLPVLPKK43 pKa = 9.86ATIGVEE49 pKa = 4.26FVTRR53 pKa = 11.84TVPLAVGGTVKK64 pKa = 10.73AQACHH69 pKa = 6.19PAAAAAAAAAAAPAAAAAAAAAGDD93 pKa = 4.98DD94 pKa = 5.46DD95 pKa = 7.02DD96 pKa = 7.73DD97 pKa = 7.71DD98 pKa = 7.63DD99 pKa = 7.68DD100 pKa = 7.62DD101 pKa = 7.62DD102 pKa = 7.57DD103 pKa = 7.36DD104 pKa = 6.95DD105 pKa = 7.12DD106 pKa = 5.26YY107 pKa = 11.84DD108 pKa = 3.84YY109 pKa = 11.16DD110 pKa = 3.89YY111 pKa = 11.1DD112 pKa = 4.21YY113 pKa = 11.15DD114 pKa = 4.12YY115 pKa = 11.14DD116 pKa = 4.79YY117 pKa = 11.92DD118 pKa = 6.04DD119 pKa = 4.95GDD121 pKa = 3.55YY122 pKa = 10.92DD123 pKa = 4.47YY124 pKa = 10.89DD125 pKa = 3.97YY126 pKa = 11.87ADD128 pKa = 4.53DD129 pKa = 4.87AVVDD133 pKa = 4.18DD134 pKa = 4.62ADD136 pKa = 4.08GNVRR140 pKa = 11.84AAAVAADD147 pKa = 4.21DD148 pKa = 5.26ADD150 pKa = 4.06VADD153 pKa = 3.82VDD155 pKa = 4.08AAAVASTADD164 pKa = 3.84IPPPPPLPPPTAAAAVAAAAAVAADD189 pKa = 4.46MGYY192 pKa = 9.55SWAGALPQHH201 pKa = 6.63NISSLPPCSRR211 pKa = 11.84SFISLL216 pKa = 3.4
MM1 pKa = 7.67SEE3 pKa = 4.12SQQGGAYY10 pKa = 8.98SHH12 pKa = 7.36LYY14 pKa = 10.27KK15 pKa = 10.49IILVGDD21 pKa = 3.52ATVGKK26 pKa = 7.42THH28 pKa = 7.32LLSRR32 pKa = 11.84YY33 pKa = 7.01TRR35 pKa = 11.84GSLPVLPKK43 pKa = 9.86ATIGVEE49 pKa = 4.26FVTRR53 pKa = 11.84TVPLAVGGTVKK64 pKa = 10.73AQACHH69 pKa = 6.19PAAAAAAAAAAAPAAAAAAAAAGDD93 pKa = 4.98DD94 pKa = 5.46DD95 pKa = 7.02DD96 pKa = 7.73DD97 pKa = 7.71DD98 pKa = 7.63DD99 pKa = 7.68DD100 pKa = 7.62DD101 pKa = 7.62DD102 pKa = 7.57DD103 pKa = 7.36DD104 pKa = 6.95DD105 pKa = 7.12DD106 pKa = 5.26YY107 pKa = 11.84DD108 pKa = 3.84YY109 pKa = 11.16DD110 pKa = 3.89YY111 pKa = 11.1DD112 pKa = 4.21YY113 pKa = 11.15DD114 pKa = 4.12YY115 pKa = 11.14DD116 pKa = 4.79YY117 pKa = 11.92DD118 pKa = 6.04DD119 pKa = 4.95GDD121 pKa = 3.55YY122 pKa = 10.92DD123 pKa = 4.47YY124 pKa = 10.89DD125 pKa = 3.97YY126 pKa = 11.87ADD128 pKa = 4.53DD129 pKa = 4.87AVVDD133 pKa = 4.18DD134 pKa = 4.62ADD136 pKa = 4.08GNVRR140 pKa = 11.84AAAVAADD147 pKa = 4.21DD148 pKa = 5.26ADD150 pKa = 4.06VADD153 pKa = 3.82VDD155 pKa = 4.08AAAVASTADD164 pKa = 3.84IPPPPPLPPPTAAAAVAAAAAVAADD189 pKa = 4.46MGYY192 pKa = 9.55SWAGALPQHH201 pKa = 6.63NISSLPPCSRR211 pKa = 11.84SFISLL216 pKa = 3.4
Molecular weight: 21.89 kDa
Isoelectric point according different methods:
Protein with the highest isoelectric point:
>tr|U6GQS1|U6GQS1_EIMAC Uncharacterized protein OS=Eimeria acervulina OX=5801 GN=EAH_00004870 PE=4 SV=1
MM1 pKa = 7.42SSSSSSNSSSNSSTNGKK18 pKa = 7.83TSITSSSSSSTSSSSTSTSSSSRR41 pKa = 11.84SSSSSSSITSTSSSSSTSSSSSTSTSSSTSTSSSTSTSSSSSSTSTSSSRR91 pKa = 11.84STSSSSSSTSSSSSTSSSSSTSTSSSSSSTSSSSSTSSSSSRR133 pKa = 11.84RR134 pKa = 11.84RR135 pKa = 11.84IRR137 pKa = 11.84RR138 pKa = 3.28
MM1 pKa = 7.42SSSSSSNSSSNSSTNGKK18 pKa = 7.83TSITSSSSSSTSSSSTSTSSSSRR41 pKa = 11.84SSSSSSSITSTSSSSSTSSSSSTSTSSSTSTSSSTSTSSSSSSTSTSSSRR91 pKa = 11.84STSSSSSSTSSSSSTSSSSSTSTSSSSSSTSSSSSTSSSSSRR133 pKa = 11.84RR134 pKa = 11.84RR135 pKa = 11.84IRR137 pKa = 11.84RR138 pKa = 3.28
Molecular weight: 13.07 kDa
Isoelectric point according different methods:
Peptides (in silico digests for buttom-up proteomics)
Below you can find in silico digests of the whole proteome with Trypsin, Chymotrypsin, Trypsin+LysC, LysN, ArgC proteases suitable for different mass spec machines.| Try ESI |
 |
|---|
| ChTry ESI |
 |
|---|
| ArgC ESI |
 |
|---|
| LysN ESI |
 |
|---|
| TryLysC ESI |
 |
|---|
| Try MALDI |
 |
|---|
| ChTry MALDI |
 |
|---|
| ArgC MALDI |
 |
|---|
| LysN MALDI |
 |
|---|
| TryLysC MALDI |
 |
|---|
| Try LTQ |
 |
|---|
| ChTry LTQ |
 |
|---|
| ArgC LTQ |
 |
|---|
| LysN LTQ |
 |
|---|
| TryLysC LTQ |
 |
|---|
| Try MSlow |
 |
|---|
| ChTry MSlow |
 |
|---|
| ArgC MSlow |
 |
|---|
| LysN MSlow |
 |
|---|
| TryLysC MSlow |
 |
|---|
| Try MShigh |
 |
|---|
| ChTry MShigh |
 |
|---|
| ArgC MShigh |
 |
|---|
| LysN MShigh |
 |
|---|
| TryLysC MShigh |
 |
|---|
General Statistics
Number of major isoforms |
Number of additional isoforms |
Number of all proteins |
Number of amino acids |
Min. Seq. Length |
Max. Seq. Length |
Avg. Seq. Length |
Avg. Mol. Weight |
|---|---|---|---|---|---|---|---|
0 |
4597400 |
12 |
10410 |
669.5 |
71.58 |
Amino acid frequency
Ala |
Cys |
Asp |
Glu |
Phe |
Gly |
His |
Ile |
Lys |
Leu |
|---|---|---|---|---|---|---|---|---|---|
15.3 ± 0.098 | 1.898 ± 0.016 |
3.586 ± 0.022 | 6.08 ± 0.034 |
2.47 ± 0.019 | 6.285 ± 0.034 |
2.092 ± 0.013 | 2.435 ± 0.022 |
3.466 ± 0.025 | 9.494 ± 0.04 |
Met |
Asn |
Gln |
Pro |
Arg |
Ser |
Thr |
Val |
Trp |
Tyr |
|---|---|---|---|---|---|---|---|---|---|
1.327 ± 0.012 | 2.367 ± 0.016 |
5.722 ± 0.029 | 10.369 ± 0.111 |
5.734 ± 0.023 | 9.846 ± 0.047 |
4.475 ± 0.021 | 4.712 ± 0.028 |
0.927 ± 0.008 | 1.415 ± 0.012 |
Most of the basic statistics you can see at this page can be downloaded from this CSV file
Proteome-pI is available under Creative Commons Attribution-NoDerivs license, for more details see here
| Reference: Kozlowski LP. Proteome-pI 2.0: Proteome Isoelectric Point Database Update. Nucleic Acids Res. 2021, doi: 10.1093/nar/gkab944 | Contact: Lukasz P. Kozlowski |
