Celeribacter manganoxidans
Taxonomy: cellular organisms; Bacteria; Proteobacteria; Alphaproteobacteria; Rhodobacterales; Rhodobacteraceae; Pacificitalea
Average proteome isoelectric point is 6.17
Get precalculated fractions of proteins
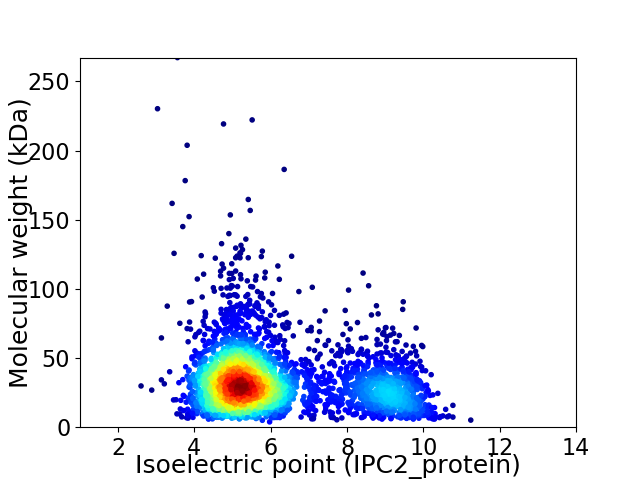
Virtual 2D-PAGE plot for 3510 proteins (isoelectric point calculated using IPC2_protein)
Get csv file with sequences according to given criteria:
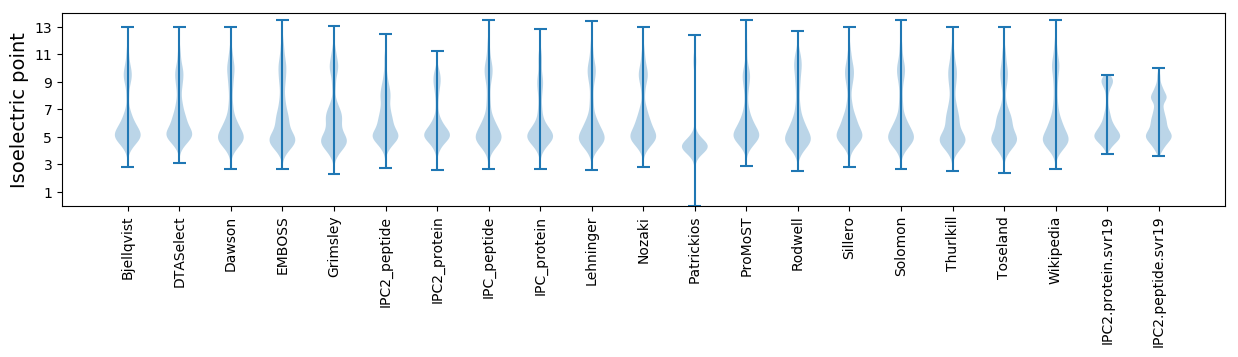
* You can choose from 21 different methods for calculating isoelectric point
Summary statistics related to proteome-wise predictions
Protein with the lowest isoelectric point:
>tr|A0A291LXZ4|A0A291LXZ4_9RHOB Uncharacterized protein OS=Celeribacter manganoxidans OX=1411902 GN=CBW24_05595 PE=4 SV=1
MM1 pKa = 7.55KK2 pKa = 10.29KK3 pKa = 10.25LAILALGTTVLATPVLAGNLQPVVVEE29 pKa = 4.42PAPAAPAIIAPVTGDD44 pKa = 2.85WTGGYY49 pKa = 10.05VGGQLGYY56 pKa = 11.43GDD58 pKa = 5.41LNSDD62 pKa = 4.74DD63 pKa = 6.08FDD65 pKa = 7.08DD66 pKa = 4.67EE67 pKa = 4.36DD68 pKa = 4.61TDD70 pKa = 3.87GGIYY74 pKa = 10.37GLQAGYY80 pKa = 10.53DD81 pKa = 3.57YY82 pKa = 11.67DD83 pKa = 3.96FGQFVLGGEE92 pKa = 4.25LAVDD96 pKa = 4.29GTSIEE101 pKa = 4.25SDD103 pKa = 3.01SGAEE107 pKa = 3.6IDD109 pKa = 4.31SITRR113 pKa = 11.84LGARR117 pKa = 11.84AGADD121 pKa = 3.06LGQTLVYY128 pKa = 9.83GALGAAQASTDD139 pKa = 3.55FGTDD143 pKa = 2.33TGYY146 pKa = 11.15YY147 pKa = 9.37FGGGVEE153 pKa = 4.28YY154 pKa = 10.04MVTDD158 pKa = 3.9SVSVGGEE165 pKa = 4.11VLSHH169 pKa = 6.87RR170 pKa = 11.84FDD172 pKa = 5.36DD173 pKa = 5.32FDD175 pKa = 4.09DD176 pKa = 3.95TGADD180 pKa = 3.61FDD182 pKa = 4.45ATTAAAKK189 pKa = 10.64VNFRR193 pKa = 11.84FF194 pKa = 4.07
MM1 pKa = 7.55KK2 pKa = 10.29KK3 pKa = 10.25LAILALGTTVLATPVLAGNLQPVVVEE29 pKa = 4.42PAPAAPAIIAPVTGDD44 pKa = 2.85WTGGYY49 pKa = 10.05VGGQLGYY56 pKa = 11.43GDD58 pKa = 5.41LNSDD62 pKa = 4.74DD63 pKa = 6.08FDD65 pKa = 7.08DD66 pKa = 4.67EE67 pKa = 4.36DD68 pKa = 4.61TDD70 pKa = 3.87GGIYY74 pKa = 10.37GLQAGYY80 pKa = 10.53DD81 pKa = 3.57YY82 pKa = 11.67DD83 pKa = 3.96FGQFVLGGEE92 pKa = 4.25LAVDD96 pKa = 4.29GTSIEE101 pKa = 4.25SDD103 pKa = 3.01SGAEE107 pKa = 3.6IDD109 pKa = 4.31SITRR113 pKa = 11.84LGARR117 pKa = 11.84AGADD121 pKa = 3.06LGQTLVYY128 pKa = 9.83GALGAAQASTDD139 pKa = 3.55FGTDD143 pKa = 2.33TGYY146 pKa = 11.15YY147 pKa = 9.37FGGGVEE153 pKa = 4.28YY154 pKa = 10.04MVTDD158 pKa = 3.9SVSVGGEE165 pKa = 4.11VLSHH169 pKa = 6.87RR170 pKa = 11.84FDD172 pKa = 5.36DD173 pKa = 5.32FDD175 pKa = 4.09DD176 pKa = 3.95TGADD180 pKa = 3.61FDD182 pKa = 4.45ATTAAAKK189 pKa = 10.64VNFRR193 pKa = 11.84FF194 pKa = 4.07
Molecular weight: 19.86 kDa
Isoelectric point according different methods:
Protein with the highest isoelectric point:
>tr|A0A291M1U4|A0A291M1U4_9RHOB Peptidase M16 OS=Celeribacter manganoxidans OX=1411902 GN=CBW24_13005 PE=3 SV=1
MM1 pKa = 7.45KK2 pKa = 9.61RR3 pKa = 11.84TFQPSNLVRR12 pKa = 11.84KK13 pKa = 9.18RR14 pKa = 11.84RR15 pKa = 11.84HH16 pKa = 4.42GFRR19 pKa = 11.84ARR21 pKa = 11.84MATKK25 pKa = 10.37AGRR28 pKa = 11.84KK29 pKa = 8.54ILNARR34 pKa = 11.84RR35 pKa = 11.84ARR37 pKa = 11.84GRR39 pKa = 11.84KK40 pKa = 9.07SLSAA44 pKa = 3.93
MM1 pKa = 7.45KK2 pKa = 9.61RR3 pKa = 11.84TFQPSNLVRR12 pKa = 11.84KK13 pKa = 9.18RR14 pKa = 11.84RR15 pKa = 11.84HH16 pKa = 4.42GFRR19 pKa = 11.84ARR21 pKa = 11.84MATKK25 pKa = 10.37AGRR28 pKa = 11.84KK29 pKa = 8.54ILNARR34 pKa = 11.84RR35 pKa = 11.84ARR37 pKa = 11.84GRR39 pKa = 11.84KK40 pKa = 9.07SLSAA44 pKa = 3.93
Molecular weight: 5.14 kDa
Isoelectric point according different methods:
Peptides (in silico digests for buttom-up proteomics)
Below you can find in silico digests of the whole proteome with Trypsin, Chymotrypsin, Trypsin+LysC, LysN, ArgC proteases suitable for different mass spec machines.| Try ESI |
 |
|---|
| ChTry ESI |
|
|---|
| ArgC ESI |
|
|---|
| LysN ESI |
|
|---|
| TryLysC ESI |
|
|---|
| Try MALDI |
|
|---|
| ChTry MALDI |
|
|---|
| ArgC MALDI |
|
|---|
| LysN MALDI |
|
|---|
| TryLysC MALDI |
|
|---|
| Try LTQ |
|
|---|
| ChTry LTQ |
|
|---|
| ArgC LTQ |
|
|---|
| LysN LTQ |
|
|---|
| TryLysC LTQ |
|
|---|
| Try MSlow |
|
|---|
| ChTry MSlow |
|
|---|
| ArgC MSlow |
|
|---|
| LysN MSlow |
|
|---|
| TryLysC MSlow |
|
|---|
| Try MShigh |
|
|---|
| ChTry MShigh |
|
|---|
| ArgC MShigh |
|
|---|
| LysN MShigh |
|
|---|
| TryLysC MShigh |
|
|---|
General Statistics
Number of major isoforms |
Number of additional isoforms |
Number of all proteins |
Number of amino acids |
Min. Seq. Length |
Max. Seq. Length |
Avg. Seq. Length |
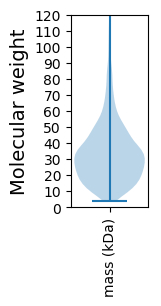
Avg. Mol. Weight |
|---|---|---|---|---|---|---|---|
0 |
1141079 |
38 |
2751 |
325.1 |
35.11 |
Amino acid frequency
Ala |
Cys |
Asp |
Glu |
Phe |
Gly |
His |
Ile |
Lys |
Leu |
|---|---|---|---|---|---|---|---|---|---|
13.052 ± 0.058 | 0.85 ± 0.013 |
6.25 ± 0.04 | 5.695 ± 0.038 |
3.473 ± 0.025 | 8.867 ± 0.05 |
2.015 ± 0.022 | 4.949 ± 0.031 |
2.518 ± 0.031 | 10.179 ± 0.053 |
Met |
Asn |
Gln |
Pro |
Arg |
Ser |
Thr |
Val |
Trp |
Tyr |
|---|---|---|---|---|---|---|---|---|---|
2.668 ± 0.021 | 2.325 ± 0.024 |
5.452 ± 0.035 | 3.138 ± 0.023 |
7.207 ± 0.053 | 4.962 ± 0.031 |
5.683 ± 0.042 | 7.234 ± 0.032 |
1.341 ± 0.015 | 2.139 ± 0.019 |
Most of the basic statistics you can see at this page can be downloaded from this CSV file
See this proteome in:

Proteome-pI is available under Creative Commons Attribution-NoDerivs license, for more details see here
| Reference: Kozlowski LP. Proteome-pI 2.0: Proteome Isoelectric Point Database Update. Nucleic Acids Res. 2021, doi: 10.1093/nar/gkab944 | Contact: Lukasz P. Kozlowski |