Red clover vein mosaic virus
Taxonomy: Viruses; Riboviria; Orthornavirae; Kitrinoviricota; Alsuviricetes; Tymovirales; Betaflexiviridae; Quinvirinae; Carlavirus
Average proteome isoelectric point is 7.34
Get precalculated fractions of proteins

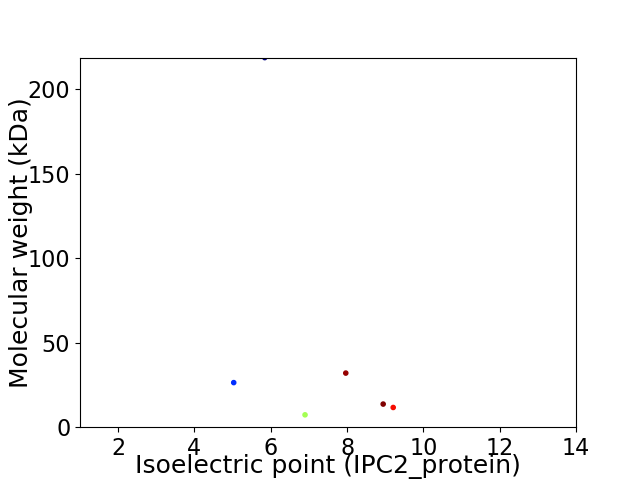
Virtual 2D-PAGE plot for 6 proteins (isoelectric point calculated using IPC2_protein)
Get csv file with sequences according to given criteria:
* You can choose from 21 different methods for calculating isoelectric point
Summary statistics related to proteome-wise predictions


Protein with the lowest isoelectric point:
>tr|C0L9F0|C0L9F0_9VIRU Movement protein TGB2 OS=Red clover vein mosaic virus OX=590403 PE=3 SV=1
MM1 pKa = 7.86DD2 pKa = 3.51VLFNVLEE9 pKa = 4.2LCGFTRR15 pKa = 11.84SSIRR19 pKa = 11.84VGNPVVILAVPGAGKK34 pKa = 7.56TTFLRR39 pKa = 11.84RR40 pKa = 11.84LLLEE44 pKa = 3.73DD45 pKa = 3.64TRR47 pKa = 11.84FIGCTFGIPDD57 pKa = 3.54PHH59 pKa = 7.2GVTGRR64 pKa = 11.84HH65 pKa = 5.72ILDD68 pKa = 3.63ARR70 pKa = 11.84TLGPVEE76 pKa = 4.1EE77 pKa = 4.75GKK79 pKa = 10.79LVLVDD84 pKa = 3.3EE85 pKa = 5.08FQRR88 pKa = 11.84GDD90 pKa = 3.66YY91 pKa = 10.22KK92 pKa = 11.3ALNPYY97 pKa = 10.13AILGDD102 pKa = 3.6VAQFCLAPNLVIEE115 pKa = 4.65ANWFKK120 pKa = 10.92SSSHH124 pKa = 6.02RR125 pKa = 11.84VPSVVCDD132 pKa = 3.9LLNTLGFSITGSSVGEE148 pKa = 3.62LHH150 pKa = 7.05ILGLFEE156 pKa = 5.52SDD158 pKa = 3.92LRR160 pKa = 11.84GTVITYY166 pKa = 10.33DD167 pKa = 3.69PEE169 pKa = 4.92ICQLLTDD176 pKa = 4.43HH177 pKa = 6.51TCEE180 pKa = 4.07HH181 pKa = 6.84TSLEE185 pKa = 4.02ACAGVEE191 pKa = 4.0FEE193 pKa = 5.06EE194 pKa = 5.69VSLLLNGPVIPAGDD208 pKa = 3.36RR209 pKa = 11.84AKK211 pKa = 10.62FYY213 pKa = 10.91LAATRR218 pKa = 11.84ASRR221 pKa = 11.84VLNIFLPIISEE232 pKa = 3.96LSIAGHH238 pKa = 6.68ASDD241 pKa = 4.11STTT244 pKa = 3.06
MM1 pKa = 7.86DD2 pKa = 3.51VLFNVLEE9 pKa = 4.2LCGFTRR15 pKa = 11.84SSIRR19 pKa = 11.84VGNPVVILAVPGAGKK34 pKa = 7.56TTFLRR39 pKa = 11.84RR40 pKa = 11.84LLLEE44 pKa = 3.73DD45 pKa = 3.64TRR47 pKa = 11.84FIGCTFGIPDD57 pKa = 3.54PHH59 pKa = 7.2GVTGRR64 pKa = 11.84HH65 pKa = 5.72ILDD68 pKa = 3.63ARR70 pKa = 11.84TLGPVEE76 pKa = 4.1EE77 pKa = 4.75GKK79 pKa = 10.79LVLVDD84 pKa = 3.3EE85 pKa = 5.08FQRR88 pKa = 11.84GDD90 pKa = 3.66YY91 pKa = 10.22KK92 pKa = 11.3ALNPYY97 pKa = 10.13AILGDD102 pKa = 3.6VAQFCLAPNLVIEE115 pKa = 4.65ANWFKK120 pKa = 10.92SSSHH124 pKa = 6.02RR125 pKa = 11.84VPSVVCDD132 pKa = 3.9LLNTLGFSITGSSVGEE148 pKa = 3.62LHH150 pKa = 7.05ILGLFEE156 pKa = 5.52SDD158 pKa = 3.92LRR160 pKa = 11.84GTVITYY166 pKa = 10.33DD167 pKa = 3.69PEE169 pKa = 4.92ICQLLTDD176 pKa = 4.43HH177 pKa = 6.51TCEE180 pKa = 4.07HH181 pKa = 6.84TSLEE185 pKa = 4.02ACAGVEE191 pKa = 4.0FEE193 pKa = 5.06EE194 pKa = 5.69VSLLLNGPVIPAGDD208 pKa = 3.36RR209 pKa = 11.84AKK211 pKa = 10.62FYY213 pKa = 10.91LAATRR218 pKa = 11.84ASRR221 pKa = 11.84VLNIFLPIISEE232 pKa = 3.96LSIAGHH238 pKa = 6.68ASDD241 pKa = 4.11STTT244 pKa = 3.06
Molecular weight: 26.38 kDa
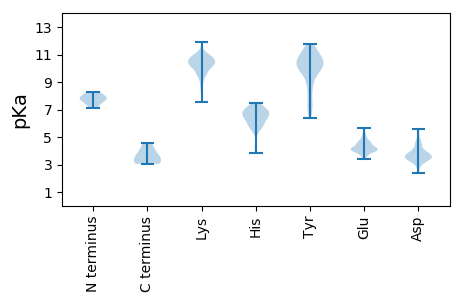
Isoelectric point according different methods:
Protein with the highest isoelectric point:
>tr|C0L9F1|C0L9F1_9VIRU 7 kDa protein OS=Red clover vein mosaic virus OX=590403 PE=3 SV=1
MM1 pKa = 7.95PLTPPPDD8 pKa = 3.36YY9 pKa = 11.06SKK11 pKa = 11.32AVLSICVGLGLAVVLFTATRR31 pKa = 11.84STLPHH36 pKa = 6.47VGDD39 pKa = 4.85NIHH42 pKa = 6.57HH43 pKa = 6.79LPHH46 pKa = 6.51GGLYY50 pKa = 10.16KK51 pKa = 10.93DD52 pKa = 3.73GTKK55 pKa = 10.39SIAFGRR61 pKa = 11.84PGGGNLTRR69 pKa = 11.84DD70 pKa = 3.5TFVRR74 pKa = 11.84PPAPLFLVIGLVLLITWVSIRR95 pKa = 11.84DD96 pKa = 3.45SRR98 pKa = 11.84VNRR101 pKa = 11.84GHH103 pKa = 6.63CSCVRR108 pKa = 11.84SS109 pKa = 3.65
MM1 pKa = 7.95PLTPPPDD8 pKa = 3.36YY9 pKa = 11.06SKK11 pKa = 11.32AVLSICVGLGLAVVLFTATRR31 pKa = 11.84STLPHH36 pKa = 6.47VGDD39 pKa = 4.85NIHH42 pKa = 6.57HH43 pKa = 6.79LPHH46 pKa = 6.51GGLYY50 pKa = 10.16KK51 pKa = 10.93DD52 pKa = 3.73GTKK55 pKa = 10.39SIAFGRR61 pKa = 11.84PGGGNLTRR69 pKa = 11.84DD70 pKa = 3.5TFVRR74 pKa = 11.84PPAPLFLVIGLVLLITWVSIRR95 pKa = 11.84DD96 pKa = 3.45SRR98 pKa = 11.84VNRR101 pKa = 11.84GHH103 pKa = 6.63CSCVRR108 pKa = 11.84SS109 pKa = 3.65
Molecular weight: 11.67 kDa
Isoelectric point according different methods:
Peptides (in silico digests for buttom-up proteomics)
Below you can find in silico digests of the whole proteome with Trypsin, Chymotrypsin, Trypsin+LysC, LysN, ArgC proteases suitable for different mass spec machines.| Try ESI |
 |
|---|
| ChTry ESI |
 |
|---|
| ArgC ESI |
 |
|---|
| LysN ESI |
 |
|---|
| TryLysC ESI |
 |
|---|
| Try MALDI |
 |
|---|
| ChTry MALDI |
 |
|---|
| ArgC MALDI |
 |
|---|
| LysN MALDI |
 |
|---|
| TryLysC MALDI |
 |
|---|
| Try LTQ |
 |
|---|
| ChTry LTQ |
 |
|---|
| ArgC LTQ |
 |
|---|
| LysN LTQ |
 |
|---|
| TryLysC LTQ |
 |
|---|
| Try MSlow |
 |
|---|
| ChTry MSlow |
 |
|---|
| ArgC MSlow |
 |
|---|
| LysN MSlow |
 |
|---|
| TryLysC MSlow |
 |
|---|
| Try MShigh |
 |
|---|
| ChTry MShigh |
 |
|---|
| ArgC MShigh |
 |
|---|
| LysN MShigh |
 |
|---|
| TryLysC MShigh |
 |
|---|
General Statistics
Number of major isoforms |
Number of additional isoforms |
Number of all proteins |
Number of amino acids |
Min. Seq. Length |
Max. Seq. Length |
Avg. Seq. Length |
Avg. Mol. Weight |
|---|---|---|---|---|---|---|---|
0 |
2763 |
65 |
1932 |
460.5 |
51.62 |
Amino acid frequency
Ala |
Cys |
Asp |
Glu |
Phe |
Gly |
His |
Ile |
Lys |
Leu |
|---|---|---|---|---|---|---|---|---|---|
6.406 ± 0.732 | 2.895 ± 0.378 |
5.212 ± 0.276 | 6.659 ± 1.045 |
6.587 ± 0.987 | 6.877 ± 0.581 |
2.208 ± 0.358 | 5.284 ± 0.463 |
6.117 ± 1.074 | 10.858 ± 0.926 |
Met |
Asn |
Gln |
Pro |
Arg |
Ser |
Thr |
Val |
Trp |
Tyr |
|---|---|---|---|---|---|---|---|---|---|
1.81 ± 0.339 | 4.126 ± 0.296 |
4.488 ± 0.656 | 2.353 ± 0.341 |
5.537 ± 0.6 | 7.673 ± 0.432 |
4.85 ± 0.68 | 6.515 ± 0.91 |
1.05 ± 0.194 | 2.497 ± 0.395 |
Most of the basic statistics you can see at this page can be downloaded from this CSV file
Proteome-pI is available under Creative Commons Attribution-NoDerivs license, for more details see here
| Reference: Kozlowski LP. Proteome-pI 2.0: Proteome Isoelectric Point Database Update. Nucleic Acids Res. 2021, doi: 10.1093/nar/gkab944 | Contact: Lukasz P. Kozlowski |
