Peach chlorotic mottle virus
Taxonomy: Viruses; Riboviria; Orthornavirae; Kitrinoviricota; Alsuviricetes; Tymovirales; Betaflexiviridae; Quinvirinae; Foveavirus
Average proteome isoelectric point is 6.65
Get precalculated fractions of proteins

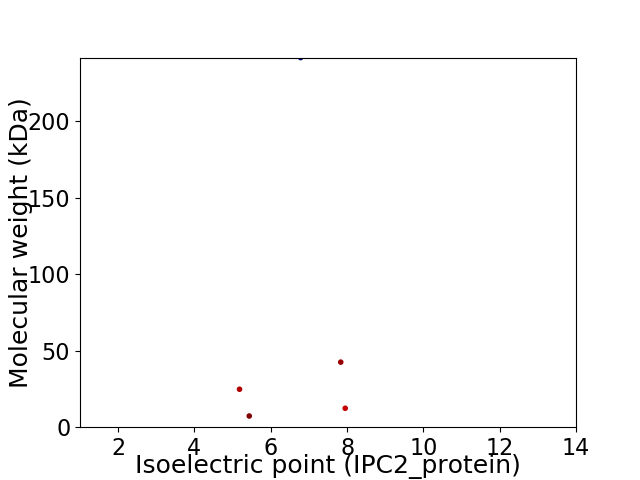
Virtual 2D-PAGE plot for 5 proteins (isoelectric point calculated using IPC2_protein)
Get csv file with sequences according to given criteria:
* You can choose from 21 different methods for calculating isoelectric point
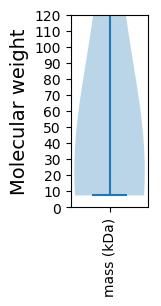
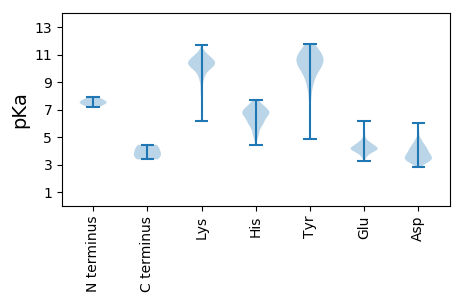
Summary statistics related to proteome-wise predictions


Protein with the lowest isoelectric point:
>tr|A8C5N4|A8C5N4_9VIRU Movement protein TGB2 OS=Peach chlorotic mottle virus OX=471498 PE=3 SV=1
MM1 pKa = 7.45DD2 pKa = 4.17TVVSLLFEE10 pKa = 4.47YY11 pKa = 10.64GFEE14 pKa = 4.1RR15 pKa = 11.84TSVPIEE21 pKa = 4.41DD22 pKa = 4.06KK23 pKa = 11.11LIVHH27 pKa = 6.95AVPGSGKK34 pKa = 6.97TTLIRR39 pKa = 11.84EE40 pKa = 4.29ALNRR44 pKa = 11.84NLGIEE49 pKa = 4.06AFSFGEE55 pKa = 3.97PDD57 pKa = 4.78LPNIWGRR64 pKa = 11.84YY65 pKa = 5.41IKK67 pKa = 10.43KK68 pKa = 10.31AISGQKK74 pKa = 8.72GTGSFCILDD83 pKa = 3.88EE84 pKa = 4.22YY85 pKa = 11.42LSGEE89 pKa = 4.18FGTGFDD95 pKa = 4.72CFFSDD100 pKa = 3.37PHH102 pKa = 6.98QNSGDD107 pKa = 3.73CAPAHH112 pKa = 5.08FVGRR116 pKa = 11.84SSQRR120 pKa = 11.84FGRR123 pKa = 11.84NTAGLLQSLGYY134 pKa = 9.73SVNSAKK140 pKa = 10.49DD141 pKa = 3.35DD142 pKa = 3.71EE143 pKa = 5.75LIFEE147 pKa = 4.38NVFRR151 pKa = 11.84AEE153 pKa = 4.03LEE155 pKa = 4.12GAVICVEE162 pKa = 4.1KK163 pKa = 10.88NVEE166 pKa = 5.07DD167 pKa = 4.19FLRR170 pKa = 11.84WNHH173 pKa = 5.86CEE175 pKa = 3.75YY176 pKa = 10.9RR177 pKa = 11.84LPCQVRR183 pKa = 11.84GSTFEE188 pKa = 4.01VVTFIHH194 pKa = 6.61EE195 pKa = 4.31LPLDD199 pKa = 3.73QLVGPDD205 pKa = 4.16LYY207 pKa = 10.63IALTRR212 pKa = 11.84HH213 pKa = 5.22SKK215 pKa = 10.44KK216 pKa = 10.27IQILTNN222 pKa = 3.61
MM1 pKa = 7.45DD2 pKa = 4.17TVVSLLFEE10 pKa = 4.47YY11 pKa = 10.64GFEE14 pKa = 4.1RR15 pKa = 11.84TSVPIEE21 pKa = 4.41DD22 pKa = 4.06KK23 pKa = 11.11LIVHH27 pKa = 6.95AVPGSGKK34 pKa = 6.97TTLIRR39 pKa = 11.84EE40 pKa = 4.29ALNRR44 pKa = 11.84NLGIEE49 pKa = 4.06AFSFGEE55 pKa = 3.97PDD57 pKa = 4.78LPNIWGRR64 pKa = 11.84YY65 pKa = 5.41IKK67 pKa = 10.43KK68 pKa = 10.31AISGQKK74 pKa = 8.72GTGSFCILDD83 pKa = 3.88EE84 pKa = 4.22YY85 pKa = 11.42LSGEE89 pKa = 4.18FGTGFDD95 pKa = 4.72CFFSDD100 pKa = 3.37PHH102 pKa = 6.98QNSGDD107 pKa = 3.73CAPAHH112 pKa = 5.08FVGRR116 pKa = 11.84SSQRR120 pKa = 11.84FGRR123 pKa = 11.84NTAGLLQSLGYY134 pKa = 9.73SVNSAKK140 pKa = 10.49DD141 pKa = 3.35DD142 pKa = 3.71EE143 pKa = 5.75LIFEE147 pKa = 4.38NVFRR151 pKa = 11.84AEE153 pKa = 4.03LEE155 pKa = 4.12GAVICVEE162 pKa = 4.1KK163 pKa = 10.88NVEE166 pKa = 5.07DD167 pKa = 4.19FLRR170 pKa = 11.84WNHH173 pKa = 5.86CEE175 pKa = 3.75YY176 pKa = 10.9RR177 pKa = 11.84LPCQVRR183 pKa = 11.84GSTFEE188 pKa = 4.01VVTFIHH194 pKa = 6.61EE195 pKa = 4.31LPLDD199 pKa = 3.73QLVGPDD205 pKa = 4.16LYY207 pKa = 10.63IALTRR212 pKa = 11.84HH213 pKa = 5.22SKK215 pKa = 10.44KK216 pKa = 10.27IQILTNN222 pKa = 3.61
Molecular weight: 24.8 kDa
Isoelectric point according different methods:
Protein with the highest isoelectric point:
>tr|A8C5N5|A8C5N5_9VIRU Movement protein TGBp3 OS=Peach chlorotic mottle virus OX=471498 PE=3 SV=1
MM1 pKa = 7.88PLAQPPDD8 pKa = 3.72FSKK11 pKa = 11.13SVFPLAIGLAVGIVIFALTRR31 pKa = 11.84STLPHH36 pKa = 6.55AGDD39 pKa = 4.63NIHH42 pKa = 6.71HH43 pKa = 6.9LPHH46 pKa = 6.55GGSYY50 pKa = 11.12VDD52 pKa = 3.52GTKK55 pKa = 10.3KK56 pKa = 10.29INYY59 pKa = 7.51CGPKK63 pKa = 10.03EE64 pKa = 4.16SFPTPGVLGLKK75 pKa = 10.13FYY77 pKa = 10.89AFCLACCILAYY88 pKa = 10.38LHH90 pKa = 6.15ATFRR94 pKa = 11.84GNNSSVRR101 pKa = 11.84CPTCINNPQHH111 pKa = 6.56CVRR114 pKa = 11.84SS115 pKa = 3.84
MM1 pKa = 7.88PLAQPPDD8 pKa = 3.72FSKK11 pKa = 11.13SVFPLAIGLAVGIVIFALTRR31 pKa = 11.84STLPHH36 pKa = 6.55AGDD39 pKa = 4.63NIHH42 pKa = 6.71HH43 pKa = 6.9LPHH46 pKa = 6.55GGSYY50 pKa = 11.12VDD52 pKa = 3.52GTKK55 pKa = 10.3KK56 pKa = 10.29INYY59 pKa = 7.51CGPKK63 pKa = 10.03EE64 pKa = 4.16SFPTPGVLGLKK75 pKa = 10.13FYY77 pKa = 10.89AFCLACCILAYY88 pKa = 10.38LHH90 pKa = 6.15ATFRR94 pKa = 11.84GNNSSVRR101 pKa = 11.84CPTCINNPQHH111 pKa = 6.56CVRR114 pKa = 11.84SS115 pKa = 3.84
Molecular weight: 12.37 kDa
Isoelectric point according different methods:
Peptides (in silico digests for buttom-up proteomics)
Below you can find in silico digests of the whole proteome with Trypsin, Chymotrypsin, Trypsin+LysC, LysN, ArgC proteases suitable for different mass spec machines.| Try ESI |
 |
|---|
| ChTry ESI |
 |
|---|
| ArgC ESI |
 |
|---|
| LysN ESI |
 |
|---|
| TryLysC ESI |
 |
|---|
| Try MALDI |
 |
|---|
| ChTry MALDI |
 |
|---|
| ArgC MALDI |
 |
|---|
| LysN MALDI |
 |
|---|
| TryLysC MALDI |
 |
|---|
| Try LTQ |
 |
|---|
| ChTry LTQ |
 |
|---|
| ArgC LTQ |
 |
|---|
| LysN LTQ |
 |
|---|
| TryLysC LTQ |
 |
|---|
| Try MSlow |
 |
|---|
| ChTry MSlow |
 |
|---|
| ArgC MSlow |
 |
|---|
| LysN MSlow |
 |
|---|
| TryLysC MSlow |
 |
|---|
| Try MShigh |
 |
|---|
| ChTry MShigh |
 |
|---|
| ArgC MShigh |
 |
|---|
| LysN MShigh |
 |
|---|
| TryLysC MShigh |
 |
|---|
General Statistics
Number of major isoforms |
Number of additional isoforms |
Number of all proteins |
Number of amino acids |
Min. Seq. Length |
Max. Seq. Length |
Avg. Seq. Length |
Avg. Mol. Weight |
|---|---|---|---|---|---|---|---|
0 |
2941 |
67 |
2135 |
588.2 |
65.71 |
Amino acid frequency
Ala |
Cys |
Asp |
Glu |
Phe |
Gly |
His |
Ile |
Lys |
Leu |
|---|---|---|---|---|---|---|---|---|---|
5.916 ± 1.451 | 2.822 ± 0.717 |
4.998 ± 0.78 | 5.848 ± 0.713 |
6.358 ± 0.684 | 6.698 ± 0.987 |
2.618 ± 0.724 | 6.256 ± 0.582 |
6.12 ± 1.151 | 9.895 ± 0.845 |
Met |
Asn |
Gln |
Pro |
Arg |
Ser |
Thr |
Val |
Trp |
Tyr |
|---|---|---|---|---|---|---|---|---|---|
1.87 ± 0.437 | 4.25 ± 0.272 |
4.76 ± 0.963 | 2.822 ± 0.296 |
4.726 ± 0.42 | 9.351 ± 0.994 |
5.168 ± 1.719 | 5.78 ± 0.634 |
1.054 ± 0.261 | 2.686 ± 0.115 |
Most of the basic statistics you can see at this page can be downloaded from this CSV file
Proteome-pI is available under Creative Commons Attribution-NoDerivs license, for more details see here
| Reference: Kozlowski LP. Proteome-pI 2.0: Proteome Isoelectric Point Database Update. Nucleic Acids Res. 2021, doi: 10.1093/nar/gkab944 | Contact: Lukasz P. Kozlowski |
