Magnaporthe oryzae (strain 70-15 / ATCC MYA-4617 / FGSC 8958) (Rice blast fungus) (Pyricularia oryzae)
Taxonomy: cellular organisms; Eukaryota; Opisthokonta; Fungi; Dikarya; Ascomycota; saccharomyceta; Pezizomycotina; leotiomyceta; sordariomyceta; Sordariomycetes; Sordariomycetidae; Magnaporthales; Pyriculariaceae; Pyricularia; Pyricularia oryzae
Average proteome isoelectric point is 6.82
Get precalculated fractions of proteins

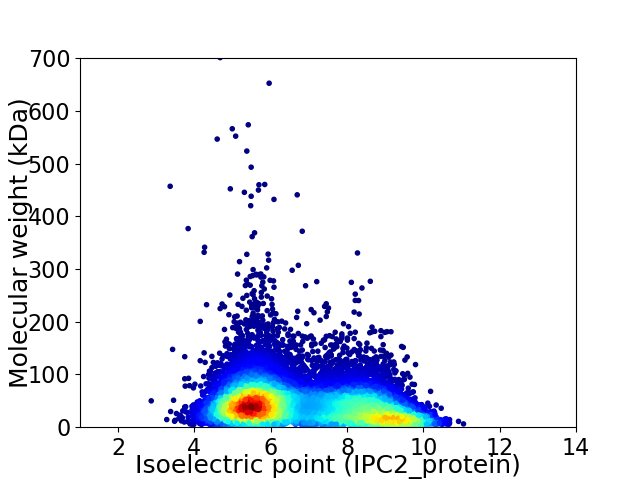
Virtual 2D-PAGE plot for 12792 proteins (isoelectric point calculated using IPC2_protein)
Get csv file with sequences according to given criteria:
* You can choose from 21 different methods for calculating isoelectric point
Summary statistics related to proteome-wise predictions


Protein with the lowest isoelectric point:
>tr|G4MPU0|G4MPU0_MAGO7 Uncharacterized protein OS=Magnaporthe oryzae (strain 70-15 / ATCC MYA-4617 / FGSC 8958) OX=242507 GN=MGG_16249 PE=4 SV=1
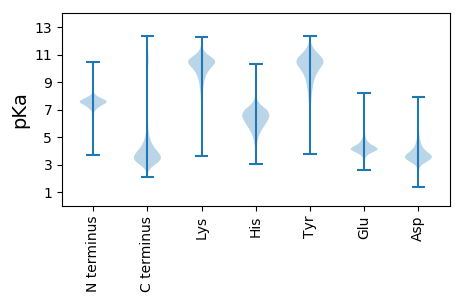
MM1 pKa = 7.57FSINKK6 pKa = 8.27VAFVAVGALAAVAGAQEE23 pKa = 4.71RR24 pKa = 11.84NTTDD28 pKa = 2.37ISSFPEE34 pKa = 3.94CAQWCVEE41 pKa = 4.17DD42 pKa = 3.75MQKK45 pKa = 10.2SEE47 pKa = 4.26KK48 pKa = 10.47ASEE51 pKa = 4.35LGCSDD56 pKa = 4.54GDD58 pKa = 4.4DD59 pKa = 3.76ACLCRR64 pKa = 11.84NANFAYY70 pKa = 9.91GVRR73 pKa = 11.84DD74 pKa = 4.68CSAQYY79 pKa = 11.2CNDD82 pKa = 3.26RR83 pKa = 11.84TTGLDD88 pKa = 3.28AIKK91 pKa = 10.75YY92 pKa = 8.94VFDD95 pKa = 3.49WCDD98 pKa = 3.26KK99 pKa = 10.93EE100 pKa = 5.48GVQLSSVVSAGATNATGIATPTGAAGGAGSASASTSPVTTAEE142 pKa = 4.21YY143 pKa = 9.52TSTMTTDD150 pKa = 3.18GSTVTTTGFTTVTPSATASGVVSTITSDD178 pKa = 2.74GSTFVSTIASSASDD192 pKa = 3.62MVSTITSDD200 pKa = 2.62GSTFVSTIAASASNAVSTIVSDD222 pKa = 3.93GSTFVSTLTDD232 pKa = 3.11AAGSVTSRR240 pKa = 11.84AGDD243 pKa = 3.52AASSATDD250 pKa = 3.34AAGTSATAEE259 pKa = 4.07GFAPQMTAAPAGILALAGVAAFLLL283 pKa = 4.38
MM1 pKa = 7.57FSINKK6 pKa = 8.27VAFVAVGALAAVAGAQEE23 pKa = 4.71RR24 pKa = 11.84NTTDD28 pKa = 2.37ISSFPEE34 pKa = 3.94CAQWCVEE41 pKa = 4.17DD42 pKa = 3.75MQKK45 pKa = 10.2SEE47 pKa = 4.26KK48 pKa = 10.47ASEE51 pKa = 4.35LGCSDD56 pKa = 4.54GDD58 pKa = 4.4DD59 pKa = 3.76ACLCRR64 pKa = 11.84NANFAYY70 pKa = 9.91GVRR73 pKa = 11.84DD74 pKa = 4.68CSAQYY79 pKa = 11.2CNDD82 pKa = 3.26RR83 pKa = 11.84TTGLDD88 pKa = 3.28AIKK91 pKa = 10.75YY92 pKa = 8.94VFDD95 pKa = 3.49WCDD98 pKa = 3.26KK99 pKa = 10.93EE100 pKa = 5.48GVQLSSVVSAGATNATGIATPTGAAGGAGSASASTSPVTTAEE142 pKa = 4.21YY143 pKa = 9.52TSTMTTDD150 pKa = 3.18GSTVTTTGFTTVTPSATASGVVSTITSDD178 pKa = 2.74GSTFVSTIASSASDD192 pKa = 3.62MVSTITSDD200 pKa = 2.62GSTFVSTIAASASNAVSTIVSDD222 pKa = 3.93GSTFVSTLTDD232 pKa = 3.11AAGSVTSRR240 pKa = 11.84AGDD243 pKa = 3.52AASSATDD250 pKa = 3.34AAGTSATAEE259 pKa = 4.07GFAPQMTAAPAGILALAGVAAFLLL283 pKa = 4.38
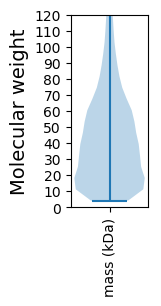
Molecular weight: 27.87 kDa
Isoelectric point according different methods:
Protein with the highest isoelectric point:
>tr|G4N422|G4N422_MAGO7 Uncharacterized protein OS=Magnaporthe oryzae (strain 70-15 / ATCC MYA-4617 / FGSC 8958) OX=242507 GN=MGG_16716 PE=4 SV=1
MM1 pKa = 7.88PSHH4 pKa = 6.91KK5 pKa = 10.39SFRR8 pKa = 11.84TKK10 pKa = 10.45QKK12 pKa = 9.84LAKK15 pKa = 9.55AQKK18 pKa = 8.59QNRR21 pKa = 11.84PIPQWIRR28 pKa = 11.84LRR30 pKa = 11.84TGNTIRR36 pKa = 11.84YY37 pKa = 5.79NAKK40 pKa = 8.89RR41 pKa = 11.84RR42 pKa = 11.84HH43 pKa = 4.14WRR45 pKa = 11.84KK46 pKa = 7.41TRR48 pKa = 11.84LGII51 pKa = 4.46
MM1 pKa = 7.88PSHH4 pKa = 6.91KK5 pKa = 10.39SFRR8 pKa = 11.84TKK10 pKa = 10.45QKK12 pKa = 9.84LAKK15 pKa = 9.55AQKK18 pKa = 8.59QNRR21 pKa = 11.84PIPQWIRR28 pKa = 11.84LRR30 pKa = 11.84TGNTIRR36 pKa = 11.84YY37 pKa = 5.79NAKK40 pKa = 8.89RR41 pKa = 11.84RR42 pKa = 11.84HH43 pKa = 4.14WRR45 pKa = 11.84KK46 pKa = 7.41TRR48 pKa = 11.84LGII51 pKa = 4.46
Molecular weight: 6.25 kDa
Isoelectric point according different methods:
Peptides (in silico digests for buttom-up proteomics)
Below you can find in silico digests of the whole proteome with Trypsin, Chymotrypsin, Trypsin+LysC, LysN, ArgC proteases suitable for different mass spec machines.| Try ESI |
 |
|---|
| ChTry ESI |
 |
|---|
| ArgC ESI |
 |
|---|
| LysN ESI |
 |
|---|
| TryLysC ESI |
 |
|---|
| Try MALDI |
 |
|---|
| ChTry MALDI |
 |
|---|
| ArgC MALDI |
 |
|---|
| LysN MALDI |
 |
|---|
| TryLysC MALDI |
 |
|---|
| Try LTQ |
 |
|---|
| ChTry LTQ |
 |
|---|
| ArgC LTQ |
 |
|---|
| LysN LTQ |
 |
|---|
| TryLysC LTQ |
 |
|---|
| Try MSlow |
 |
|---|
| ChTry MSlow |
 |
|---|
| ArgC MSlow |
 |
|---|
| LysN MSlow |
 |
|---|
| TryLysC MSlow |
 |
|---|
| Try MShigh |
 |
|---|
| ChTry MShigh |
 |
|---|
| ArgC MShigh |
 |
|---|
| LysN MShigh |
 |
|---|
| TryLysC MShigh |
 |
|---|
General Statistics
Number of major isoforms |
Number of additional isoforms |
Number of all proteins |
Number of amino acids |
Min. Seq. Length |
Max. Seq. Length |
Avg. Seq. Length |
Avg. Mol. Weight |
|---|---|---|---|---|---|---|---|
5652975 |
34 |
6541 |
441.9 |
48.53 |
Amino acid frequency
Ala |
Cys |
Asp |
Glu |
Phe |
Gly |
His |
Ile |
Lys |
Leu |
|---|---|---|---|---|---|---|---|---|---|
9.434 ± 0.027 | 1.27 ± 0.01 |
5.741 ± 0.016 | 5.895 ± 0.024 |
3.49 ± 0.016 | 7.438 ± 0.022 |
2.311 ± 0.009 | 4.364 ± 0.016 |
4.721 ± 0.02 | 8.503 ± 0.027 |
Met |
Asn |
Gln |
Pro |
Arg |
Ser |
Thr |
Val |
Trp |
Tyr |
|---|---|---|---|---|---|---|---|---|---|
2.273 ± 0.009 | 3.512 ± 0.013 |
6.328 ± 0.027 | 4.063 ± 0.019 |
6.4 ± 0.022 | 8.144 ± 0.022 |
5.886 ± 0.021 | 6.286 ± 0.019 |
1.423 ± 0.009 | 2.521 ± 0.012 |
Most of the basic statistics you can see at this page can be downloaded from this CSV file
Proteome-pI is available under Creative Commons Attribution-NoDerivs license, for more details see here
| Reference: Kozlowski LP. Proteome-pI 2.0: Proteome Isoelectric Point Database Update. Nucleic Acids Res. 2021, doi: 10.1093/nar/gkab944 | Contact: Lukasz P. Kozlowski |
