Eclipta yellow vein virus
Taxonomy: Viruses; Monodnaviria; Shotokuvirae; Cressdnaviricota; Repensiviricetes; Geplafuvirales; Geminiviridae; Begomovirus
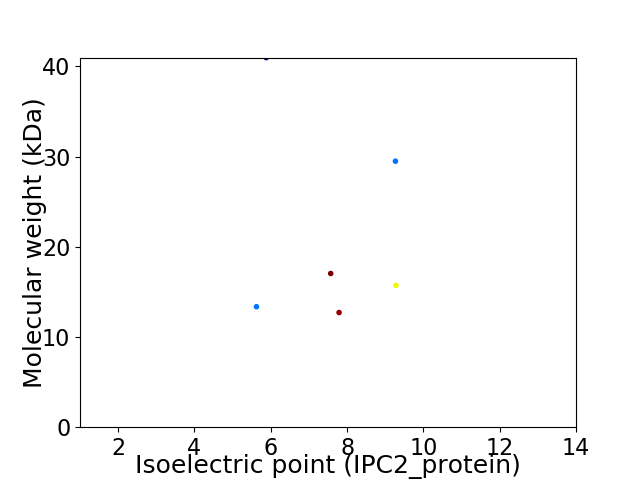
Average proteome isoelectric point is 7.41
Get precalculated fractions of proteins

Virtual 2D-PAGE plot for 6 proteins (isoelectric point calculated using IPC2_protein)
Get csv file with sequences according to given criteria:
* You can choose from 21 different methods for calculating isoelectric point
Summary statistics related to proteome-wise predictions


Protein with the lowest isoelectric point:
>tr|A0A0M4ATQ7|A0A0M4ATQ7_9GEMI Replication-associated protein OS=Eclipta yellow vein virus OX=875324 GN=AC1 PE=3 SV=1
MM1 pKa = 8.06WDD3 pKa = 3.35PLLNEE8 pKa = 4.38FPEE11 pKa = 4.68TVHH14 pKa = 7.0GFRR17 pKa = 11.84CMLAVKK23 pKa = 9.91YY24 pKa = 9.14LQQLSEE30 pKa = 4.6EE31 pKa = 4.3YY32 pKa = 10.92SPDD35 pKa = 3.21TVGYY39 pKa = 10.56DD40 pKa = 3.97LIRR43 pKa = 11.84DD44 pKa = 4.54LICILRR50 pKa = 11.84SRR52 pKa = 11.84NYY54 pKa = 9.65VEE56 pKa = 4.26ASCRR60 pKa = 11.84YY61 pKa = 7.36RR62 pKa = 11.84HH63 pKa = 6.19FYY65 pKa = 10.95ARR67 pKa = 11.84VEE69 pKa = 4.15STPASEE75 pKa = 4.25LRR77 pKa = 11.84QPIHH81 pKa = 6.33QPCCCPHH88 pKa = 6.78CPPPKK93 pKa = 8.72ISHH96 pKa = 6.17VGEE99 pKa = 4.01QAHH102 pKa = 6.28EE103 pKa = 4.35SEE105 pKa = 4.4AHH107 pKa = 5.7NVQDD111 pKa = 3.58VQKK114 pKa = 10.15PP115 pKa = 3.38
MM1 pKa = 8.06WDD3 pKa = 3.35PLLNEE8 pKa = 4.38FPEE11 pKa = 4.68TVHH14 pKa = 7.0GFRR17 pKa = 11.84CMLAVKK23 pKa = 9.91YY24 pKa = 9.14LQQLSEE30 pKa = 4.6EE31 pKa = 4.3YY32 pKa = 10.92SPDD35 pKa = 3.21TVGYY39 pKa = 10.56DD40 pKa = 3.97LIRR43 pKa = 11.84DD44 pKa = 4.54LICILRR50 pKa = 11.84SRR52 pKa = 11.84NYY54 pKa = 9.65VEE56 pKa = 4.26ASCRR60 pKa = 11.84YY61 pKa = 7.36RR62 pKa = 11.84HH63 pKa = 6.19FYY65 pKa = 10.95ARR67 pKa = 11.84VEE69 pKa = 4.15STPASEE75 pKa = 4.25LRR77 pKa = 11.84QPIHH81 pKa = 6.33QPCCCPHH88 pKa = 6.78CPPPKK93 pKa = 8.72ISHH96 pKa = 6.17VGEE99 pKa = 4.01QAHH102 pKa = 6.28EE103 pKa = 4.35SEE105 pKa = 4.4AHH107 pKa = 5.7NVQDD111 pKa = 3.58VQKK114 pKa = 10.15PP115 pKa = 3.38
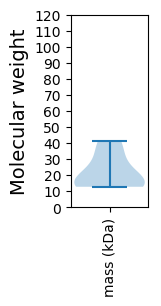
Molecular weight: 13.35 kDa
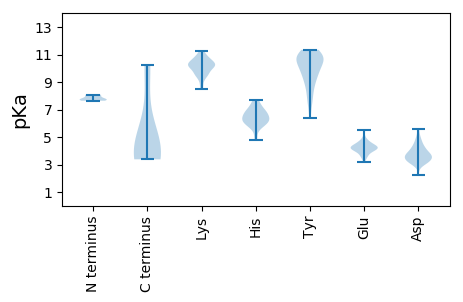
Isoelectric point according different methods:
Protein with the highest isoelectric point:
>tr|A0A0M4AKS6|A0A0M4AKS6_9GEMI AC4 protein OS=Eclipta yellow vein virus OX=875324 GN=AC4 PE=3 SV=1
MM1 pKa = 8.08DD2 pKa = 5.22LRR4 pKa = 11.84TGEE7 pKa = 5.09PITAAQAWSGAYY19 pKa = 7.65TWEE22 pKa = 4.36VPNPLYY28 pKa = 10.63FKK30 pKa = 10.52ILSHH34 pKa = 7.01DD35 pKa = 3.64NRR37 pKa = 11.84PFTSKK42 pKa = 10.08MDD44 pKa = 4.22IITIRR49 pKa = 11.84IQFNYY54 pKa = 9.82NLRR57 pKa = 11.84RR58 pKa = 11.84ALGVHH63 pKa = 5.82KK64 pKa = 10.54CFLTFRR70 pKa = 11.84VWTTLHH76 pKa = 6.82PPTGLFLRR84 pKa = 11.84VFKK87 pKa = 9.93TQVLKK92 pKa = 11.01YY93 pKa = 9.9LNNLGVISINAIIRR107 pKa = 11.84AVDD110 pKa = 3.21HH111 pKa = 6.21VLWKK115 pKa = 10.63KK116 pKa = 10.8LEE118 pKa = 3.8QTVYY122 pKa = 10.69VNQDD126 pKa = 3.08SEE128 pKa = 4.68IKK130 pKa = 10.48FNLYY134 pKa = 10.23
MM1 pKa = 8.08DD2 pKa = 5.22LRR4 pKa = 11.84TGEE7 pKa = 5.09PITAAQAWSGAYY19 pKa = 7.65TWEE22 pKa = 4.36VPNPLYY28 pKa = 10.63FKK30 pKa = 10.52ILSHH34 pKa = 7.01DD35 pKa = 3.64NRR37 pKa = 11.84PFTSKK42 pKa = 10.08MDD44 pKa = 4.22IITIRR49 pKa = 11.84IQFNYY54 pKa = 9.82NLRR57 pKa = 11.84RR58 pKa = 11.84ALGVHH63 pKa = 5.82KK64 pKa = 10.54CFLTFRR70 pKa = 11.84VWTTLHH76 pKa = 6.82PPTGLFLRR84 pKa = 11.84VFKK87 pKa = 9.93TQVLKK92 pKa = 11.01YY93 pKa = 9.9LNNLGVISINAIIRR107 pKa = 11.84AVDD110 pKa = 3.21HH111 pKa = 6.21VLWKK115 pKa = 10.63KK116 pKa = 10.8LEE118 pKa = 3.8QTVYY122 pKa = 10.69VNQDD126 pKa = 3.08SEE128 pKa = 4.68IKK130 pKa = 10.48FNLYY134 pKa = 10.23
Molecular weight: 15.71 kDa
Isoelectric point according different methods:
Peptides (in silico digests for buttom-up proteomics)
Below you can find in silico digests of the whole proteome with Trypsin, Chymotrypsin, Trypsin+LysC, LysN, ArgC proteases suitable for different mass spec machines.| Try ESI |
 |
|---|
| ChTry ESI |
 |
|---|
| ArgC ESI |
 |
|---|
| LysN ESI |
 |
|---|
| TryLysC ESI |
 |
|---|
| Try MALDI |
 |
|---|
| ChTry MALDI |
 |
|---|
| ArgC MALDI |
 |
|---|
| LysN MALDI |
 |
|---|
| TryLysC MALDI |
 |
|---|
| Try LTQ |
 |
|---|
| ChTry LTQ |
 |
|---|
| ArgC LTQ |
 |
|---|
| LysN LTQ |
 |
|---|
| TryLysC LTQ |
 |
|---|
| Try MSlow |
 |
|---|
| ChTry MSlow |
 |
|---|
| ArgC MSlow |
 |
|---|
| LysN MSlow |
 |
|---|
| TryLysC MSlow |
 |
|---|
| Try MShigh |
 |
|---|
| ChTry MShigh |
 |
|---|
| ArgC MShigh |
 |
|---|
| LysN MShigh |
 |
|---|
| TryLysC MShigh |
 |
|---|
General Statistics
Number of major isoforms |
Number of additional isoforms |
Number of all proteins |
Number of amino acids |
Min. Seq. Length |
Max. Seq. Length |
Avg. Seq. Length |
Avg. Mol. Weight |
|---|---|---|---|---|---|---|---|
0 |
1130 |
112 |
363 |
188.3 |
21.54 |
Amino acid frequency
Ala |
Cys |
Asp |
Glu |
Phe |
Gly |
His |
Ile |
Lys |
Leu |
|---|---|---|---|---|---|---|---|---|---|
5.575 ± 0.952 | 2.478 ± 0.656 |
4.779 ± 0.264 | 5.044 ± 0.972 |
4.513 ± 0.489 | 4.956 ± 0.542 |
3.628 ± 0.566 | 5.398 ± 0.503 |
5.487 ± 0.65 | 7.345 ± 0.927 |
Met |
Asn |
Gln |
Pro |
Arg |
Ser |
Thr |
Val |
Trp |
Tyr |
|---|---|---|---|---|---|---|---|---|---|
1.858 ± 0.536 | 5.929 ± 0.548 |
6.372 ± 0.572 | 5.221 ± 0.93 |
6.106 ± 0.709 | 8.053 ± 1.371 |
5.664 ± 0.935 | 5.929 ± 1.312 |
1.681 ± 0.228 | 3.982 ± 0.503 |
Most of the basic statistics you can see at this page can be downloaded from this CSV file
Proteome-pI is available under Creative Commons Attribution-NoDerivs license, for more details see here
| Reference: Kozlowski LP. Proteome-pI 2.0: Proteome Isoelectric Point Database Update. Nucleic Acids Res. 2021, doi: 10.1093/nar/gkab944 | Contact: Lukasz P. Kozlowski |
