Lactobacillus phage ATCC 8014-B2
Taxonomy: Viruses; Duplodnaviria; Heunggongvirae; Uroviricota; Caudoviricetes; Caudovirales; Siphoviridae; Tybeckvirinae; Douglaswolinvirus; Lactobacillus virus B2
Average proteome isoelectric point is 5.93
Get precalculated fractions of proteins

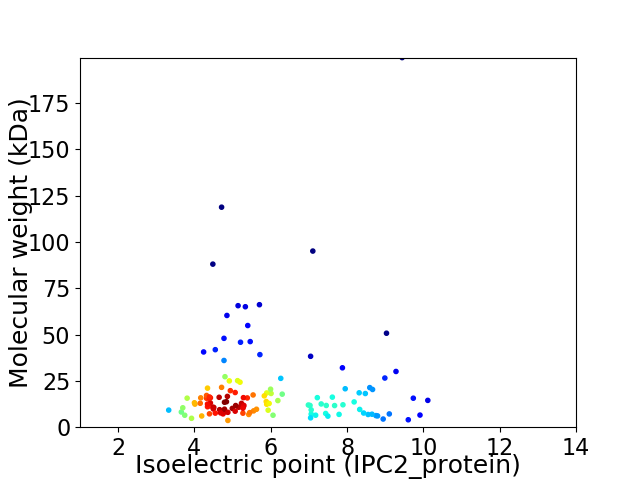
Virtual 2D-PAGE plot for 127 proteins (isoelectric point calculated using IPC2_protein)
Get csv file with sequences according to given criteria:
* You can choose from 21 different methods for calculating isoelectric point
Summary statistics related to proteome-wise predictions


Protein with the lowest isoelectric point:
>tr|K4I4D1|K4I4D1_9CAUD Uncharacterized protein OS=Lactobacillus phage ATCC 8014-B2 OX=1225795 GN=8014-B2_0048 PE=4 SV=1
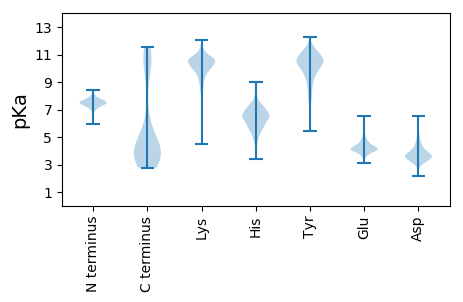
MM1 pKa = 7.02TANKK5 pKa = 9.75KK6 pKa = 9.2FQEE9 pKa = 4.05LLNNGEE15 pKa = 4.29LTDD18 pKa = 3.92EE19 pKa = 4.24QQEE22 pKa = 3.89LAYY25 pKa = 9.9QYY27 pKa = 11.6GVIDD31 pKa = 3.8VNSLYY36 pKa = 10.68EE37 pKa = 4.09YY38 pKa = 10.32LTDD41 pKa = 3.77TLSSEE46 pKa = 4.23SFEE49 pKa = 4.49DD50 pKa = 3.16SGRR53 pKa = 11.84VIEE56 pKa = 5.61LLNEE60 pKa = 4.07LLKK63 pKa = 10.59HH64 pKa = 6.69DD65 pKa = 4.48SNDD68 pKa = 3.28YY69 pKa = 11.05VLYY72 pKa = 10.72DD73 pKa = 3.94DD74 pKa = 6.04DD75 pKa = 6.28KK76 pKa = 11.38ISEE79 pKa = 4.5LDD81 pKa = 3.26YY82 pKa = 10.49DD83 pKa = 4.31TIEE86 pKa = 6.04DD87 pKa = 3.72ILNN90 pKa = 3.58
MM1 pKa = 7.02TANKK5 pKa = 9.75KK6 pKa = 9.2FQEE9 pKa = 4.05LLNNGEE15 pKa = 4.29LTDD18 pKa = 3.92EE19 pKa = 4.24QQEE22 pKa = 3.89LAYY25 pKa = 9.9QYY27 pKa = 11.6GVIDD31 pKa = 3.8VNSLYY36 pKa = 10.68EE37 pKa = 4.09YY38 pKa = 10.32LTDD41 pKa = 3.77TLSSEE46 pKa = 4.23SFEE49 pKa = 4.49DD50 pKa = 3.16SGRR53 pKa = 11.84VIEE56 pKa = 5.61LLNEE60 pKa = 4.07LLKK63 pKa = 10.59HH64 pKa = 6.69DD65 pKa = 4.48SNDD68 pKa = 3.28YY69 pKa = 11.05VLYY72 pKa = 10.72DD73 pKa = 3.94DD74 pKa = 6.04DD75 pKa = 6.28KK76 pKa = 11.38ISEE79 pKa = 4.5LDD81 pKa = 3.26YY82 pKa = 10.49DD83 pKa = 4.31TIEE86 pKa = 6.04DD87 pKa = 3.72ILNN90 pKa = 3.58
Molecular weight: 10.48 kDa
Isoelectric point according different methods:
Protein with the highest isoelectric point:
>tr|K4I0B3|K4I0B3_9CAUD Uncharacterized protein OS=Lactobacillus phage ATCC 8014-B2 OX=1225795 GN=8014-B2_001 PE=4 SV=1
MM1 pKa = 7.5KK2 pKa = 9.92LSKK5 pKa = 9.92VAKK8 pKa = 9.09VVMAIVAGVMLSVMVINTKK27 pKa = 10.71AEE29 pKa = 3.89ASKK32 pKa = 10.84PNYY35 pKa = 9.82AYY37 pKa = 11.06SLVRR41 pKa = 11.84TKK43 pKa = 10.26QHH45 pKa = 5.05TVKK48 pKa = 9.84LTNTGKK54 pKa = 8.6TEE56 pKa = 3.44NMYY59 pKa = 10.55RR60 pKa = 11.84ITVKK64 pKa = 10.27QGKK67 pKa = 9.24HH68 pKa = 3.76STWYY72 pKa = 10.63YY73 pKa = 8.03MALIAKK79 pKa = 8.24QSWTVKK85 pKa = 10.08QSGKK89 pKa = 10.33YY90 pKa = 8.55SVTVRR95 pKa = 11.84RR96 pKa = 11.84ISKK99 pKa = 10.47ADD101 pKa = 3.53EE102 pKa = 4.1KK103 pKa = 11.29RR104 pKa = 11.84NADD107 pKa = 3.61PRR109 pKa = 11.84NHH111 pKa = 6.3FVPQGISNTQRR122 pKa = 11.84TVWNRR127 pKa = 2.9
MM1 pKa = 7.5KK2 pKa = 9.92LSKK5 pKa = 9.92VAKK8 pKa = 9.09VVMAIVAGVMLSVMVINTKK27 pKa = 10.71AEE29 pKa = 3.89ASKK32 pKa = 10.84PNYY35 pKa = 9.82AYY37 pKa = 11.06SLVRR41 pKa = 11.84TKK43 pKa = 10.26QHH45 pKa = 5.05TVKK48 pKa = 9.84LTNTGKK54 pKa = 8.6TEE56 pKa = 3.44NMYY59 pKa = 10.55RR60 pKa = 11.84ITVKK64 pKa = 10.27QGKK67 pKa = 9.24HH68 pKa = 3.76STWYY72 pKa = 10.63YY73 pKa = 8.03MALIAKK79 pKa = 8.24QSWTVKK85 pKa = 10.08QSGKK89 pKa = 10.33YY90 pKa = 8.55SVTVRR95 pKa = 11.84RR96 pKa = 11.84ISKK99 pKa = 10.47ADD101 pKa = 3.53EE102 pKa = 4.1KK103 pKa = 11.29RR104 pKa = 11.84NADD107 pKa = 3.61PRR109 pKa = 11.84NHH111 pKa = 6.3FVPQGISNTQRR122 pKa = 11.84TVWNRR127 pKa = 2.9
Molecular weight: 14.48 kDa
Isoelectric point according different methods:
Peptides (in silico digests for buttom-up proteomics)
Below you can find in silico digests of the whole proteome with Trypsin, Chymotrypsin, Trypsin+LysC, LysN, ArgC proteases suitable for different mass spec machines.| Try ESI |
 |
|---|
| ChTry ESI |
 |
|---|
| ArgC ESI |
 |
|---|
| LysN ESI |
 |
|---|
| TryLysC ESI |
 |
|---|
| Try MALDI |
 |
|---|
| ChTry MALDI |
 |
|---|
| ArgC MALDI |
 |
|---|
| LysN MALDI |
 |
|---|
| TryLysC MALDI |
 |
|---|
| Try LTQ |
 |
|---|
| ChTry LTQ |
 |
|---|
| ArgC LTQ |
 |
|---|
| LysN LTQ |
 |
|---|
| TryLysC LTQ |
 |
|---|
| Try MSlow |
 |
|---|
| ChTry MSlow |
 |
|---|
| ArgC MSlow |
 |
|---|
| LysN MSlow |
 |
|---|
| TryLysC MSlow |
 |
|---|
| Try MShigh |
 |
|---|
| ChTry MShigh |
 |
|---|
| ArgC MShigh |
 |
|---|
| LysN MShigh |
 |
|---|
| TryLysC MShigh |
 |
|---|
General Statistics
Number of major isoforms |
Number of additional isoforms |
Number of all proteins |
Number of amino acids |
Min. Seq. Length |
Max. Seq. Length |
Avg. Seq. Length |
Avg. Mol. Weight |
|---|---|---|---|---|---|---|---|
0 |
23151 |
32 |
1887 |
182.3 |
20.54 |
Amino acid frequency
Ala |
Cys |
Asp |
Glu |
Phe |
Gly |
His |
Ile |
Lys |
Leu |
|---|---|---|---|---|---|---|---|---|---|
6.125 ± 0.471 | 0.799 ± 0.116 |
7.015 ± 0.38 | 6.367 ± 0.355 |
3.909 ± 0.171 | 6.764 ± 0.389 |
1.728 ± 0.133 | 6.782 ± 0.206 |
8.142 ± 0.318 | 8.242 ± 0.208 |
Met |
Asn |
Gln |
Pro |
Arg |
Ser |
Thr |
Val |
Trp |
Tyr |
|---|---|---|---|---|---|---|---|---|---|
2.747 ± 0.118 | 6.492 ± 0.202 |
2.51 ± 0.167 | 3.287 ± 0.176 |
3.339 ± 0.157 | 7.455 ± 0.327 |
5.978 ± 0.276 | 6.432 ± 0.228 |
1.184 ± 0.114 | 4.704 ± 0.247 |
Most of the basic statistics you can see at this page can be downloaded from this CSV file
Proteome-pI is available under Creative Commons Attribution-NoDerivs license, for more details see here
| Reference: Kozlowski LP. Proteome-pI 2.0: Proteome Isoelectric Point Database Update. Nucleic Acids Res. 2021, doi: 10.1093/nar/gkab944 | Contact: Lukasz P. Kozlowski |
