Nitrosomonas cryotolerans ATCC 49181
Taxonomy: cellular organisms; Bacteria; Proteobacteria; Betaproteobacteria; Nitrosomonadales; Nitrosomonadaceae; Nitrosomonas; Nitrosomonas cryotolerans
Average proteome isoelectric point is 6.65
Get precalculated fractions of proteins

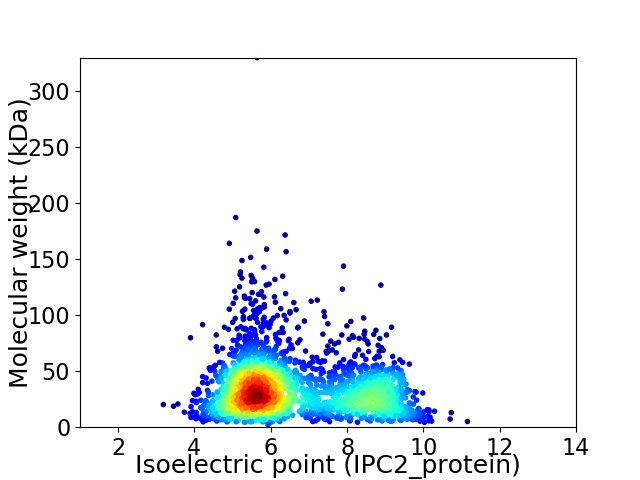
Virtual 2D-PAGE plot for 2414 proteins (isoelectric point calculated using IPC2_protein)
Get csv file with sequences according to given criteria:
* You can choose from 21 different methods for calculating isoelectric point
Summary statistics related to proteome-wise predictions


Protein with the lowest isoelectric point:
>tr|A0A1N6G367|A0A1N6G367_9PROT Transposase IS605 OrfB family central region OS=Nitrosomonas cryotolerans ATCC 49181 OX=1131553 GN=SAMN02743940_0528 PE=3 SV=1
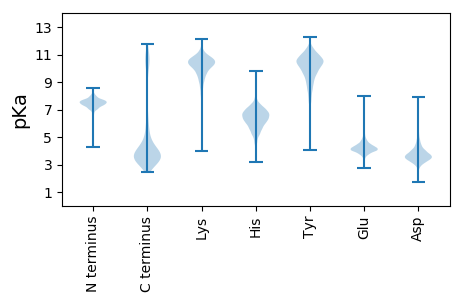
MM1 pKa = 7.2ISYY4 pKa = 10.33RR5 pKa = 11.84RR6 pKa = 11.84FKK8 pKa = 10.82SQISITLLVTALSWLVCNLAVAAPPTNDD36 pKa = 2.69TFTNSTSVTVGFNEE50 pKa = 4.34VLDD53 pKa = 4.08TTEE56 pKa = 4.19ATTDD60 pKa = 3.38SDD62 pKa = 4.42DD63 pKa = 3.72AQLNMSCGAPASDD76 pKa = 3.03ASVWYY81 pKa = 10.33SFNATSDD88 pKa = 3.61TNVVVDD94 pKa = 4.42VSQSNYY100 pKa = 9.3SAGVLVSEE108 pKa = 5.46GSQDD112 pKa = 3.49NLQTIACGPGAVPFFATAGTTYY134 pKa = 10.75YY135 pKa = 11.11VLAIDD140 pKa = 4.71DD141 pKa = 3.96QLDD144 pKa = 3.58GGGNGGLLSISFNEE158 pKa = 4.24VAPTTLDD165 pKa = 3.6DD166 pKa = 3.95FTVNPVGIVNTRR178 pKa = 11.84TGVATISGTYY188 pKa = 7.79TCNNGDD194 pKa = 3.9FLGLFADD201 pKa = 4.8ASQDD205 pKa = 3.25VGRR208 pKa = 11.84IATIRR213 pKa = 11.84GDD215 pKa = 3.85FFFFDD220 pKa = 4.1SGTCNGTSHH229 pKa = 7.27PWSGNVVPQNGKK241 pKa = 9.31FAGGKK246 pKa = 9.99AMTMTFAFTCGPFQCADD263 pKa = 3.49GYY265 pKa = 10.59IEE267 pKa = 5.14QKK269 pKa = 9.68IQLRR273 pKa = 11.84GGKK276 pKa = 9.2KK277 pKa = 9.65
MM1 pKa = 7.2ISYY4 pKa = 10.33RR5 pKa = 11.84RR6 pKa = 11.84FKK8 pKa = 10.82SQISITLLVTALSWLVCNLAVAAPPTNDD36 pKa = 2.69TFTNSTSVTVGFNEE50 pKa = 4.34VLDD53 pKa = 4.08TTEE56 pKa = 4.19ATTDD60 pKa = 3.38SDD62 pKa = 4.42DD63 pKa = 3.72AQLNMSCGAPASDD76 pKa = 3.03ASVWYY81 pKa = 10.33SFNATSDD88 pKa = 3.61TNVVVDD94 pKa = 4.42VSQSNYY100 pKa = 9.3SAGVLVSEE108 pKa = 5.46GSQDD112 pKa = 3.49NLQTIACGPGAVPFFATAGTTYY134 pKa = 10.75YY135 pKa = 11.11VLAIDD140 pKa = 4.71DD141 pKa = 3.96QLDD144 pKa = 3.58GGGNGGLLSISFNEE158 pKa = 4.24VAPTTLDD165 pKa = 3.6DD166 pKa = 3.95FTVNPVGIVNTRR178 pKa = 11.84TGVATISGTYY188 pKa = 7.79TCNNGDD194 pKa = 3.9FLGLFADD201 pKa = 4.8ASQDD205 pKa = 3.25VGRR208 pKa = 11.84IATIRR213 pKa = 11.84GDD215 pKa = 3.85FFFFDD220 pKa = 4.1SGTCNGTSHH229 pKa = 7.27PWSGNVVPQNGKK241 pKa = 9.31FAGGKK246 pKa = 9.99AMTMTFAFTCGPFQCADD263 pKa = 3.49GYY265 pKa = 10.59IEE267 pKa = 5.14QKK269 pKa = 9.68IQLRR273 pKa = 11.84GGKK276 pKa = 9.2KK277 pKa = 9.65
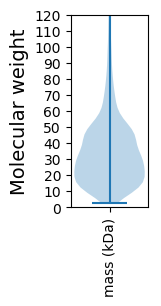
Molecular weight: 29.06 kDa
Isoelectric point according different methods:
Protein with the highest isoelectric point:
>tr|A0A1N6GXW4|A0A1N6GXW4_9PROT 3-phosphoshikimate 1-carboxyvinyltransferase OS=Nitrosomonas cryotolerans ATCC 49181 OX=1131553 GN=aroA PE=3 SV=1
MM1 pKa = 7.35KK2 pKa = 9.36RR3 pKa = 11.84TYY5 pKa = 9.6QPSVIRR11 pKa = 11.84RR12 pKa = 11.84RR13 pKa = 11.84RR14 pKa = 11.84THH16 pKa = 5.9GFLVRR21 pKa = 11.84MKK23 pKa = 9.48TRR25 pKa = 11.84GGAAVIRR32 pKa = 11.84ARR34 pKa = 11.84RR35 pKa = 11.84AKK37 pKa = 9.98GRR39 pKa = 11.84VRR41 pKa = 11.84LGVV44 pKa = 3.2
MM1 pKa = 7.35KK2 pKa = 9.36RR3 pKa = 11.84TYY5 pKa = 9.6QPSVIRR11 pKa = 11.84RR12 pKa = 11.84RR13 pKa = 11.84RR14 pKa = 11.84THH16 pKa = 5.9GFLVRR21 pKa = 11.84MKK23 pKa = 9.48TRR25 pKa = 11.84GGAAVIRR32 pKa = 11.84ARR34 pKa = 11.84RR35 pKa = 11.84AKK37 pKa = 9.98GRR39 pKa = 11.84VRR41 pKa = 11.84LGVV44 pKa = 3.2
Molecular weight: 5.12 kDa
Isoelectric point according different methods:
Peptides (in silico digests for buttom-up proteomics)
Below you can find in silico digests of the whole proteome with Trypsin, Chymotrypsin, Trypsin+LysC, LysN, ArgC proteases suitable for different mass spec machines.| Try ESI |
 |
|---|
| ChTry ESI |
 |
|---|
| ArgC ESI |
 |
|---|
| LysN ESI |
 |
|---|
| TryLysC ESI |
 |
|---|
| Try MALDI |
 |
|---|
| ChTry MALDI |
 |
|---|
| ArgC MALDI |
 |
|---|
| LysN MALDI |
 |
|---|
| TryLysC MALDI |
 |
|---|
| Try LTQ |
 |
|---|
| ChTry LTQ |
 |
|---|
| ArgC LTQ |
 |
|---|
| LysN LTQ |
 |
|---|
| TryLysC LTQ |
 |
|---|
| Try MSlow |
 |
|---|
| ChTry MSlow |
 |
|---|
| ArgC MSlow |
 |
|---|
| LysN MSlow |
 |
|---|
| TryLysC MSlow |
 |
|---|
| Try MShigh |
 |
|---|
| ChTry MShigh |
 |
|---|
| ArgC MShigh |
 |
|---|
| LysN MShigh |
 |
|---|
| TryLysC MShigh |
 |
|---|
General Statistics
Number of major isoforms |
Number of additional isoforms |
Number of all proteins |
Number of amino acids |
Min. Seq. Length |
Max. Seq. Length |
Avg. Seq. Length |
Avg. Mol. Weight |
|---|---|---|---|---|---|---|---|
0 |
781301 |
19 |
2921 |
323.7 |
36.09 |
Amino acid frequency
Ala |
Cys |
Asp |
Glu |
Phe |
Gly |
His |
Ile |
Lys |
Leu |
|---|---|---|---|---|---|---|---|---|---|
8.658 ± 0.05 | 1.045 ± 0.016 |
5.141 ± 0.035 | 5.787 ± 0.038 |
4.058 ± 0.034 | 6.791 ± 0.049 |
2.577 ± 0.025 | 7.231 ± 0.043 |
4.968 ± 0.054 | 10.716 ± 0.057 |
Met |
Asn |
Gln |
Pro |
Arg |
Ser |
Thr |
Val |
Trp |
Tyr |
|---|---|---|---|---|---|---|---|---|---|
2.557 ± 0.022 | 4.204 ± 0.04 |
4.176 ± 0.029 | 4.321 ± 0.038 |
5.527 ± 0.036 | 6.272 ± 0.035 |
5.392 ± 0.031 | 6.359 ± 0.037 |
1.281 ± 0.022 | 2.94 ± 0.027 |
Most of the basic statistics you can see at this page can be downloaded from this CSV file
Proteome-pI is available under Creative Commons Attribution-NoDerivs license, for more details see here
| Reference: Kozlowski LP. Proteome-pI 2.0: Proteome Isoelectric Point Database Update. Nucleic Acids Res. 2021, doi: 10.1093/nar/gkab944 | Contact: Lukasz P. Kozlowski |
