Bhendi yellow vein Delhi virus [2004:New Delhi]
Taxonomy: Viruses; Monodnaviria; Shotokuvirae; Cressdnaviricota; Repensiviricetes; Geplafuvirales; Geminiviridae; Begomovirus; unclassified Begomovirus; Bhendi yellow vein Delhi virus
Average proteome isoelectric point is 7.81
Get precalculated fractions of proteins
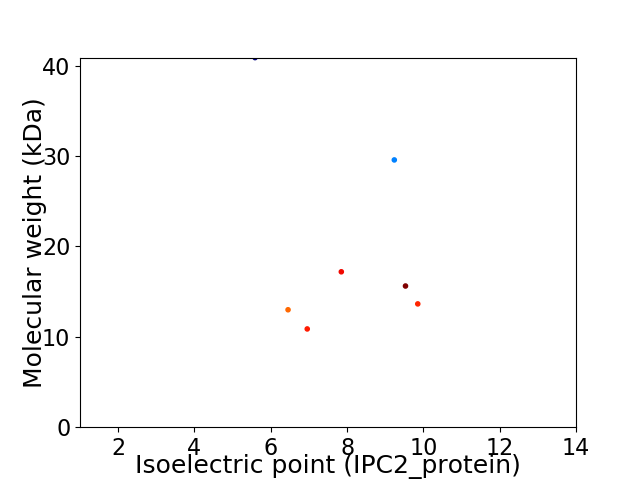
Virtual 2D-PAGE plot for 7 proteins (isoelectric point calculated using IPC2_protein)
Get csv file with sequences according to given criteria:
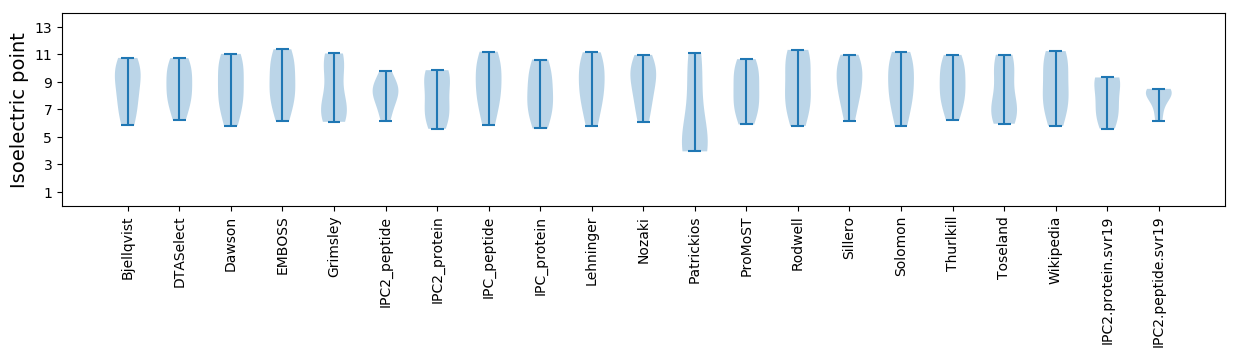
* You can choose from 21 different methods for calculating isoelectric point
Summary statistics related to proteome-wise predictions
Protein with the lowest isoelectric point:
>tr|B8YB85|B8YB85_9GEMI AC4 OS=Bhendi yellow vein Delhi virus [2004:New Delhi] OX=587620 GN=AC4 PE=3 SV=1
MM1 pKa = 7.68APPSRR6 pKa = 11.84FRR8 pKa = 11.84INAKK12 pKa = 10.3NYY14 pKa = 8.19FLTYY18 pKa = 9.06PKK20 pKa = 10.53CSLTKK25 pKa = 10.69EE26 pKa = 4.09EE27 pKa = 5.55ALSQLQNLQTPTNKK41 pKa = 9.87KK42 pKa = 9.42FIKK45 pKa = 9.65ICRR48 pKa = 11.84EE49 pKa = 3.52LHH51 pKa = 6.26EE52 pKa = 4.93NGEE55 pKa = 4.28PHH57 pKa = 6.66LHH59 pKa = 6.03VLIQFEE65 pKa = 4.78GKK67 pKa = 9.95YY68 pKa = 9.77KK69 pKa = 10.46CQNQRR74 pKa = 11.84FFDD77 pKa = 3.97LVSPSRR83 pKa = 11.84SVHH86 pKa = 4.99FHH88 pKa = 6.71PNIQGAKK95 pKa = 9.25SSSDD99 pKa = 3.11VKK101 pKa = 11.24SYY103 pKa = 10.79IDD105 pKa = 3.7KK106 pKa = 11.33DD107 pKa = 3.49GDD109 pKa = 3.67TLEE112 pKa = 4.14WGEE115 pKa = 3.84FQIDD119 pKa = 3.21GRR121 pKa = 11.84SARR124 pKa = 11.84GGQQTANDD132 pKa = 4.05AYY134 pKa = 10.69AAALNAGSKK143 pKa = 10.33SEE145 pKa = 3.85ALKK148 pKa = 10.64VIRR151 pKa = 11.84EE152 pKa = 4.37LAPKK156 pKa = 10.23DD157 pKa = 3.59YY158 pKa = 11.19VLQFHH163 pKa = 6.76NLNANLDD170 pKa = 4.3RR171 pKa = 11.84IFTPPLEE178 pKa = 4.56VYY180 pKa = 10.28VSPFSSSSFDD190 pKa = 3.41QVPEE194 pKa = 3.95EE195 pKa = 4.04LEE197 pKa = 3.96EE198 pKa = 4.17WVSEE202 pKa = 4.2NVVDD206 pKa = 4.8AAARR210 pKa = 11.84PLRR213 pKa = 11.84PLSLVLEE220 pKa = 4.7GDD222 pKa = 3.46SRR224 pKa = 11.84TGKK227 pKa = 8.52TMWARR232 pKa = 11.84SLGPHH237 pKa = 6.71NYY239 pKa = 10.18LCGHH243 pKa = 7.38LDD245 pKa = 4.18LSPKK249 pKa = 10.15VYY251 pKa = 11.07SNDD254 pKa = 2.25AWYY257 pKa = 10.92NVIDD261 pKa = 4.79DD262 pKa = 4.33VDD264 pKa = 3.73PHH266 pKa = 6.08FLKK269 pKa = 10.67HH270 pKa = 5.9FKK272 pKa = 10.69EE273 pKa = 4.43FMGAQRR279 pKa = 11.84DD280 pKa = 3.81WQSNTKK286 pKa = 9.6YY287 pKa = 10.57GKK289 pKa = 9.12PVQIKK294 pKa = 10.41GGIPTIFLCNPGPNSCYY311 pKa = 10.3KK312 pKa = 10.59EE313 pKa = 3.94FLDD316 pKa = 4.84EE317 pKa = 4.5EE318 pKa = 4.61KK319 pKa = 11.18NSALKK324 pKa = 10.53NWALKK329 pKa = 10.11NAIFITLAEE338 pKa = 4.23PLYY341 pKa = 11.11SGANQSTAQGSQEE354 pKa = 3.75TDD356 pKa = 3.09QEE358 pKa = 4.42EE359 pKa = 4.53EE360 pKa = 4.19SGSS363 pKa = 3.6
MM1 pKa = 7.68APPSRR6 pKa = 11.84FRR8 pKa = 11.84INAKK12 pKa = 10.3NYY14 pKa = 8.19FLTYY18 pKa = 9.06PKK20 pKa = 10.53CSLTKK25 pKa = 10.69EE26 pKa = 4.09EE27 pKa = 5.55ALSQLQNLQTPTNKK41 pKa = 9.87KK42 pKa = 9.42FIKK45 pKa = 9.65ICRR48 pKa = 11.84EE49 pKa = 3.52LHH51 pKa = 6.26EE52 pKa = 4.93NGEE55 pKa = 4.28PHH57 pKa = 6.66LHH59 pKa = 6.03VLIQFEE65 pKa = 4.78GKK67 pKa = 9.95YY68 pKa = 9.77KK69 pKa = 10.46CQNQRR74 pKa = 11.84FFDD77 pKa = 3.97LVSPSRR83 pKa = 11.84SVHH86 pKa = 4.99FHH88 pKa = 6.71PNIQGAKK95 pKa = 9.25SSSDD99 pKa = 3.11VKK101 pKa = 11.24SYY103 pKa = 10.79IDD105 pKa = 3.7KK106 pKa = 11.33DD107 pKa = 3.49GDD109 pKa = 3.67TLEE112 pKa = 4.14WGEE115 pKa = 3.84FQIDD119 pKa = 3.21GRR121 pKa = 11.84SARR124 pKa = 11.84GGQQTANDD132 pKa = 4.05AYY134 pKa = 10.69AAALNAGSKK143 pKa = 10.33SEE145 pKa = 3.85ALKK148 pKa = 10.64VIRR151 pKa = 11.84EE152 pKa = 4.37LAPKK156 pKa = 10.23DD157 pKa = 3.59YY158 pKa = 11.19VLQFHH163 pKa = 6.76NLNANLDD170 pKa = 4.3RR171 pKa = 11.84IFTPPLEE178 pKa = 4.56VYY180 pKa = 10.28VSPFSSSSFDD190 pKa = 3.41QVPEE194 pKa = 3.95EE195 pKa = 4.04LEE197 pKa = 3.96EE198 pKa = 4.17WVSEE202 pKa = 4.2NVVDD206 pKa = 4.8AAARR210 pKa = 11.84PLRR213 pKa = 11.84PLSLVLEE220 pKa = 4.7GDD222 pKa = 3.46SRR224 pKa = 11.84TGKK227 pKa = 8.52TMWARR232 pKa = 11.84SLGPHH237 pKa = 6.71NYY239 pKa = 10.18LCGHH243 pKa = 7.38LDD245 pKa = 4.18LSPKK249 pKa = 10.15VYY251 pKa = 11.07SNDD254 pKa = 2.25AWYY257 pKa = 10.92NVIDD261 pKa = 4.79DD262 pKa = 4.33VDD264 pKa = 3.73PHH266 pKa = 6.08FLKK269 pKa = 10.67HH270 pKa = 5.9FKK272 pKa = 10.69EE273 pKa = 4.43FMGAQRR279 pKa = 11.84DD280 pKa = 3.81WQSNTKK286 pKa = 9.6YY287 pKa = 10.57GKK289 pKa = 9.12PVQIKK294 pKa = 10.41GGIPTIFLCNPGPNSCYY311 pKa = 10.3KK312 pKa = 10.59EE313 pKa = 3.94FLDD316 pKa = 4.84EE317 pKa = 4.5EE318 pKa = 4.61KK319 pKa = 11.18NSALKK324 pKa = 10.53NWALKK329 pKa = 10.11NAIFITLAEE338 pKa = 4.23PLYY341 pKa = 11.11SGANQSTAQGSQEE354 pKa = 3.75TDD356 pKa = 3.09QEE358 pKa = 4.42EE359 pKa = 4.53EE360 pKa = 4.19SGSS363 pKa = 3.6
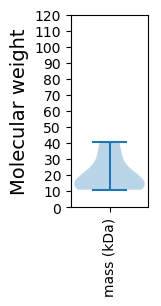
Molecular weight: 40.9 kDa
Isoelectric point according different methods:
Protein with the highest isoelectric point:
>tr|B8YB82|B8YB82_9GEMI Replication enhancer OS=Bhendi yellow vein Delhi virus [2004:New Delhi] OX=587620 GN=AC3 PE=3 SV=1
MM1 pKa = 6.62GTSHH5 pKa = 7.4IKK7 pKa = 9.23HH8 pKa = 5.19QRR10 pKa = 11.84ILGMILVFSCFLLIVNNIIVNPDD33 pKa = 3.2KK34 pKa = 11.33LLDD37 pKa = 3.47QSLFLTRR44 pKa = 11.84ILTTRR49 pKa = 11.84NGCMPFPQHH58 pKa = 6.5LVTIPMHH65 pKa = 5.98ILHH68 pKa = 6.66GRR70 pKa = 11.84RR71 pKa = 11.84TGFVVKK77 pKa = 10.41HH78 pKa = 5.68IKK80 pKa = 10.52YY81 pKa = 8.07LTKK84 pKa = 10.04ILGFIYY90 pKa = 10.28RR91 pKa = 11.84SSITNKK97 pKa = 9.54EE98 pKa = 3.56KK99 pKa = 9.65HH100 pKa = 5.68HH101 pKa = 7.13RR102 pKa = 11.84IRR104 pKa = 11.84MVLGLDD110 pKa = 3.63VLVHH114 pKa = 6.48PNLTT118 pKa = 3.57
MM1 pKa = 6.62GTSHH5 pKa = 7.4IKK7 pKa = 9.23HH8 pKa = 5.19QRR10 pKa = 11.84ILGMILVFSCFLLIVNNIIVNPDD33 pKa = 3.2KK34 pKa = 11.33LLDD37 pKa = 3.47QSLFLTRR44 pKa = 11.84ILTTRR49 pKa = 11.84NGCMPFPQHH58 pKa = 6.5LVTIPMHH65 pKa = 5.98ILHH68 pKa = 6.66GRR70 pKa = 11.84RR71 pKa = 11.84TGFVVKK77 pKa = 10.41HH78 pKa = 5.68IKK80 pKa = 10.52YY81 pKa = 8.07LTKK84 pKa = 10.04ILGFIYY90 pKa = 10.28RR91 pKa = 11.84SSITNKK97 pKa = 9.54EE98 pKa = 3.56KK99 pKa = 9.65HH100 pKa = 5.68HH101 pKa = 7.13RR102 pKa = 11.84IRR104 pKa = 11.84MVLGLDD110 pKa = 3.63VLVHH114 pKa = 6.48PNLTT118 pKa = 3.57
Molecular weight: 13.64 kDa
Isoelectric point according different methods:
Peptides (in silico digests for buttom-up proteomics)
Below you can find in silico digests of the whole proteome with Trypsin, Chymotrypsin, Trypsin+LysC, LysN, ArgC proteases suitable for different mass spec machines.| Try ESI |
 |
|---|
| ChTry ESI |
|
|---|
| ArgC ESI |
|
|---|
| LysN ESI |
|
|---|
| TryLysC ESI |
|
|---|
| Try MALDI |
|
|---|
| ChTry MALDI |
|
|---|
| ArgC MALDI |
|
|---|
| LysN MALDI |
|
|---|
| TryLysC MALDI |
|
|---|
| Try LTQ |
|
|---|
| ChTry LTQ |
|
|---|
| ArgC LTQ |
|
|---|
| LysN LTQ |
|
|---|
| TryLysC LTQ |
|
|---|
| Try MSlow |
|
|---|
| ChTry MSlow |
|
|---|
| ArgC MSlow |
|
|---|
| LysN MSlow |
|
|---|
| TryLysC MSlow |
|
|---|
| Try MShigh |
|
|---|
| ChTry MShigh |
|
|---|
| ArgC MShigh |
|
|---|
| LysN MShigh |
|
|---|
| TryLysC MShigh |
|
|---|
General Statistics
Number of major isoforms |
Number of additional isoforms |
Number of all proteins |
Number of amino acids |
Min. Seq. Length |
Max. Seq. Length |
Avg. Seq. Length |
Avg. Mol. Weight |
|---|---|---|---|---|---|---|---|
0 |
1234 |
100 |
363 |
176.3 |
20.12 |
Amino acid frequency
Ala |
Cys |
Asp |
Glu |
Phe |
Gly |
His |
Ile |
Lys |
Leu |
|---|---|---|---|---|---|---|---|---|---|
4.943 ± 1.025 | 2.35 ± 0.38 |
4.457 ± 0.417 | 4.619 ± 0.862 |
4.052 ± 0.528 | 4.862 ± 0.432 |
3.728 ± 0.651 | 5.348 ± 0.671 |
5.754 ± 0.726 | 8.671 ± 0.996 |
Met |
Asn |
Gln |
Pro |
Arg |
Ser |
Thr |
Val |
Trp |
Tyr |
|---|---|---|---|---|---|---|---|---|---|
2.431 ± 0.69 | 6.24 ± 0.446 |
5.835 ± 0.485 | 4.943 ± 0.799 |
6.402 ± 0.98 | 8.671 ± 1.479 |
5.997 ± 1.125 | 5.916 ± 1.112 |
1.297 ± 0.168 | 3.485 ± 0.531 |
Most of the basic statistics you can see at this page can be downloaded from this CSV file
See this proteome in:

Proteome-pI is available under Creative Commons Attribution-NoDerivs license, for more details see here
| Reference: Kozlowski LP. Proteome-pI 2.0: Proteome Isoelectric Point Database Update. Nucleic Acids Res. 2021, doi: 10.1093/nar/gkab944 | Contact: Lukasz P. Kozlowski |