Tardibacter chloracetimidivorans
Taxonomy: cellular organisms; Bacteria; Proteobacteria; Alphaproteobacteria; Sphingomonadales; Sphingomonadaceae; Tardibacter
Average proteome isoelectric point is 6.48
Get precalculated fractions of proteins

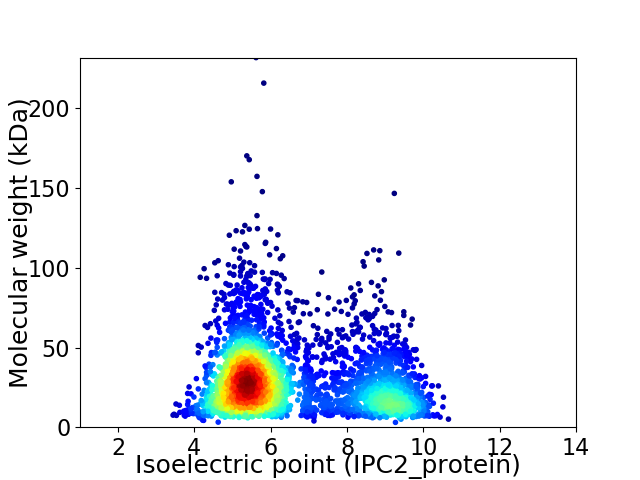
Virtual 2D-PAGE plot for 3667 proteins (isoelectric point calculated using IPC2_protein)
Get csv file with sequences according to given criteria:
* You can choose from 21 different methods for calculating isoelectric point
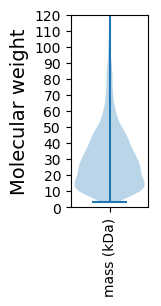
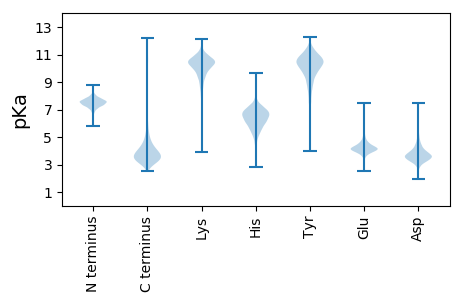
Summary statistics related to proteome-wise predictions


Protein with the lowest isoelectric point:
>tr|A0A1L3ZSV4|A0A1L3ZSV4_9SPHN Uncharacterized protein OS=Tardibacter chloracetimidivorans OX=1921510 GN=BSL82_04760 PE=4 SV=1
MM1 pKa = 7.88AEE3 pKa = 4.05PADD6 pKa = 3.72LQLAIEE12 pKa = 4.61AFNTAVEE19 pKa = 4.65AYY21 pKa = 10.22VADD24 pKa = 4.04ATPGLDD30 pKa = 3.85KK31 pKa = 11.35VSLTHH36 pKa = 7.5DD37 pKa = 3.27GVTVYY42 pKa = 10.54FNEE45 pKa = 4.24TGLASAVLSTGEE57 pKa = 3.96ALQDD61 pKa = 3.35AVNALGVAVAADD73 pKa = 3.72ADD75 pKa = 4.26GVTKK79 pKa = 10.49FVEE82 pKa = 3.84LDD84 pKa = 3.51GYY86 pKa = 10.42DD87 pKa = 3.34AQIANGVLYY96 pKa = 9.22QLRR99 pKa = 11.84HH100 pKa = 5.98DD101 pKa = 3.9
MM1 pKa = 7.88AEE3 pKa = 4.05PADD6 pKa = 3.72LQLAIEE12 pKa = 4.61AFNTAVEE19 pKa = 4.65AYY21 pKa = 10.22VADD24 pKa = 4.04ATPGLDD30 pKa = 3.85KK31 pKa = 11.35VSLTHH36 pKa = 7.5DD37 pKa = 3.27GVTVYY42 pKa = 10.54FNEE45 pKa = 4.24TGLASAVLSTGEE57 pKa = 3.96ALQDD61 pKa = 3.35AVNALGVAVAADD73 pKa = 3.72ADD75 pKa = 4.26GVTKK79 pKa = 10.49FVEE82 pKa = 3.84LDD84 pKa = 3.51GYY86 pKa = 10.42DD87 pKa = 3.34AQIANGVLYY96 pKa = 9.22QLRR99 pKa = 11.84HH100 pKa = 5.98DD101 pKa = 3.9
Molecular weight: 10.46 kDa
Isoelectric point according different methods:
Protein with the highest isoelectric point:
>tr|A0A1L4A109|A0A1L4A109_9SPHN Uncharacterized protein OS=Tardibacter chloracetimidivorans OX=1921510 GN=BSL82_19175 PE=4 SV=1
MM1 pKa = 6.76FTVANSISLSAPLARR16 pKa = 11.84VWRR19 pKa = 11.84VLVDD23 pKa = 2.9VDD25 pKa = 5.38RR26 pKa = 11.84YY27 pKa = 10.49RR28 pKa = 11.84DD29 pKa = 3.24WHH31 pKa = 5.82PTVGLEE37 pKa = 5.24SDD39 pKa = 3.49PADD42 pKa = 4.01PKK44 pKa = 11.24KK45 pKa = 10.68LLCTYY50 pKa = 7.73WRR52 pKa = 11.84PGWTDD57 pKa = 3.04PVISADD63 pKa = 3.32GRR65 pKa = 11.84IVCLEE70 pKa = 4.24RR71 pKa = 11.84PCHH74 pKa = 4.88FAWRR78 pKa = 11.84VGIKK82 pKa = 10.42GLLQIEE88 pKa = 4.48EE89 pKa = 4.44GFHH92 pKa = 6.26LKK94 pKa = 10.3KK95 pKa = 10.78SPEE98 pKa = 4.12GTRR101 pKa = 11.84LTHH104 pKa = 7.11RR105 pKa = 11.84LCCSGIGSWPGIVTSPFLRR124 pKa = 11.84RR125 pKa = 11.84QLVRR129 pKa = 11.84TGDD132 pKa = 3.4SLEE135 pKa = 3.79RR136 pKa = 11.84HH137 pKa = 5.8LRR139 pKa = 11.84RR140 pKa = 11.84GTVISRR146 pKa = 11.84YY147 pKa = 7.21AQRR150 pKa = 11.84NARR153 pKa = 11.84PRR155 pKa = 3.36
MM1 pKa = 6.76FTVANSISLSAPLARR16 pKa = 11.84VWRR19 pKa = 11.84VLVDD23 pKa = 2.9VDD25 pKa = 5.38RR26 pKa = 11.84YY27 pKa = 10.49RR28 pKa = 11.84DD29 pKa = 3.24WHH31 pKa = 5.82PTVGLEE37 pKa = 5.24SDD39 pKa = 3.49PADD42 pKa = 4.01PKK44 pKa = 11.24KK45 pKa = 10.68LLCTYY50 pKa = 7.73WRR52 pKa = 11.84PGWTDD57 pKa = 3.04PVISADD63 pKa = 3.32GRR65 pKa = 11.84IVCLEE70 pKa = 4.24RR71 pKa = 11.84PCHH74 pKa = 4.88FAWRR78 pKa = 11.84VGIKK82 pKa = 10.42GLLQIEE88 pKa = 4.48EE89 pKa = 4.44GFHH92 pKa = 6.26LKK94 pKa = 10.3KK95 pKa = 10.78SPEE98 pKa = 4.12GTRR101 pKa = 11.84LTHH104 pKa = 7.11RR105 pKa = 11.84LCCSGIGSWPGIVTSPFLRR124 pKa = 11.84RR125 pKa = 11.84QLVRR129 pKa = 11.84TGDD132 pKa = 3.4SLEE135 pKa = 3.79RR136 pKa = 11.84HH137 pKa = 5.8LRR139 pKa = 11.84RR140 pKa = 11.84GTVISRR146 pKa = 11.84YY147 pKa = 7.21AQRR150 pKa = 11.84NARR153 pKa = 11.84PRR155 pKa = 3.36
Molecular weight: 17.71 kDa
Isoelectric point according different methods:
Peptides (in silico digests for buttom-up proteomics)
Below you can find in silico digests of the whole proteome with Trypsin, Chymotrypsin, Trypsin+LysC, LysN, ArgC proteases suitable for different mass spec machines.| Try ESI |
 |
|---|
| ChTry ESI |
 |
|---|
| ArgC ESI |
 |
|---|
| LysN ESI |
 |
|---|
| TryLysC ESI |
 |
|---|
| Try MALDI |
 |
|---|
| ChTry MALDI |
 |
|---|
| ArgC MALDI |
 |
|---|
| LysN MALDI |
 |
|---|
| TryLysC MALDI |
 |
|---|
| Try LTQ |
 |
|---|
| ChTry LTQ |
 |
|---|
| ArgC LTQ |
 |
|---|
| LysN LTQ |
 |
|---|
| TryLysC LTQ |
 |
|---|
| Try MSlow |
 |
|---|
| ChTry MSlow |
 |
|---|
| ArgC MSlow |
 |
|---|
| LysN MSlow |
 |
|---|
| TryLysC MSlow |
 |
|---|
| Try MShigh |
 |
|---|
| ChTry MShigh |
 |
|---|
| ArgC MShigh |
 |
|---|
| LysN MShigh |
 |
|---|
| TryLysC MShigh |
 |
|---|
General Statistics
Number of major isoforms |
Number of additional isoforms |
Number of all proteins |
Number of amino acids |
Min. Seq. Length |
Max. Seq. Length |
Avg. Seq. Length |
Avg. Mol. Weight |
|---|---|---|---|---|---|---|---|
0 |
1070970 |
28 |
2117 |
292.1 |
31.71 |
Amino acid frequency
Ala |
Cys |
Asp |
Glu |
Phe |
Gly |
His |
Ile |
Lys |
Leu |
|---|---|---|---|---|---|---|---|---|---|
12.76 ± 0.061 | 0.865 ± 0.013 |
5.974 ± 0.026 | 5.777 ± 0.039 |
3.472 ± 0.025 | 8.694 ± 0.041 |
2.084 ± 0.019 | 5.047 ± 0.027 |
3.051 ± 0.033 | 9.786 ± 0.048 |
Met |
Asn |
Gln |
Pro |
Arg |
Ser |
Thr |
Val |
Trp |
Tyr |
|---|---|---|---|---|---|---|---|---|---|
2.463 ± 0.022 | 2.577 ± 0.023 |
5.194 ± 0.03 | 3.141 ± 0.021 |
7.662 ± 0.043 | 5.48 ± 0.027 |
5.132 ± 0.029 | 7.162 ± 0.031 |
1.433 ± 0.016 | 2.247 ± 0.02 |
Most of the basic statistics you can see at this page can be downloaded from this CSV file
Proteome-pI is available under Creative Commons Attribution-NoDerivs license, for more details see here
| Reference: Kozlowski LP. Proteome-pI 2.0: Proteome Isoelectric Point Database Update. Nucleic Acids Res. 2021, doi: 10.1093/nar/gkab944 | Contact: Lukasz P. Kozlowski |
