Wallemia ichthyophaga (strain EXF-994 / CBS 113033)
Taxonomy: cellular organisms; Eukaryota; Opisthokonta; Fungi; Dikarya; Basidiomycota; Wallemiomycotina; Wallemiomycetes; Wallemiales; Wallemiaceae; Wallemia; Wallemia ichthyophaga
Average proteome isoelectric point is 6.49
Get precalculated fractions of proteins

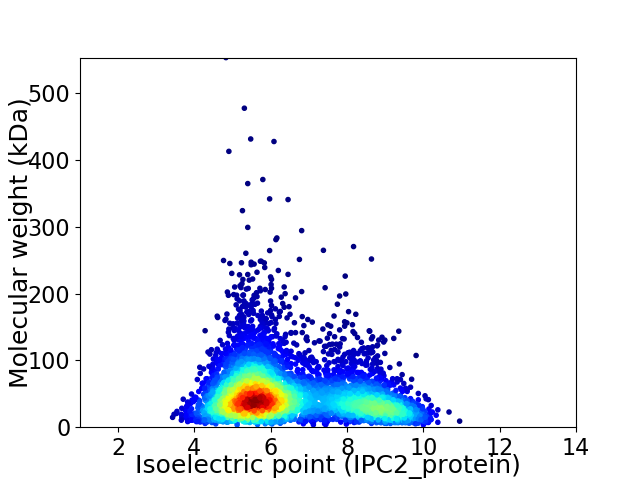
Virtual 2D-PAGE plot for 4836 proteins (isoelectric point calculated using IPC2_protein)
Get csv file with sequences according to given criteria:
* You can choose from 21 different methods for calculating isoelectric point
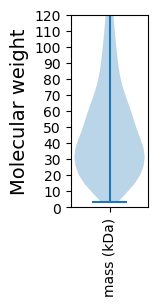
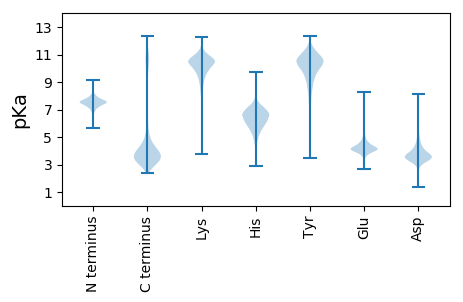
Summary statistics related to proteome-wise predictions


Protein with the lowest isoelectric point:
>tr|R9AKY9|R9AKY9_WALI9 Hydroxyacid-oxoacid transhydrogenase OS=Wallemia ichthyophaga (strain EXF-994 / CBS 113033) OX=1299270 GN=J056_003424 PE=3 SV=1
MM1 pKa = 7.3VLLKK5 pKa = 9.84TATTLLAATAAYY17 pKa = 9.34AWNHH21 pKa = 5.09TASDD25 pKa = 4.22VIATGTMGTTNPPEE39 pKa = 3.92ATMGTEE45 pKa = 4.46LNQTSVARR53 pKa = 11.84LVSINSIDD61 pKa = 3.76DD62 pKa = 3.49FCFFGPKK69 pKa = 8.57EE70 pKa = 4.15ANVTIGDD77 pKa = 3.93TEE79 pKa = 4.47GEE81 pKa = 4.17QVAWCTKK88 pKa = 8.17PRR90 pKa = 11.84NNARR94 pKa = 11.84VIPDD98 pKa = 3.27GTITSTHH105 pKa = 5.23FVKK108 pKa = 10.2TPAYY112 pKa = 8.72VQVSGFGDD120 pKa = 3.53LTKK123 pKa = 10.41IGVKK127 pKa = 10.51DD128 pKa = 3.4GDD130 pKa = 3.85YY131 pKa = 11.16GGEE134 pKa = 4.16LDD136 pKa = 3.7PHH138 pKa = 6.59GATGDD143 pKa = 3.82GNPVGGNVTSDD154 pKa = 2.95IVNGTSTSYY163 pKa = 11.27AEE165 pKa = 3.67WMEE168 pKa = 4.58FISYY172 pKa = 9.35EE173 pKa = 3.97QFCIRR178 pKa = 11.84ICTASNDD185 pKa = 3.28TWGAPVMCEE194 pKa = 3.73HH195 pKa = 7.14KK196 pKa = 10.3LDD198 pKa = 3.69EE199 pKa = 4.55MGCGFVMPDD208 pKa = 3.64AGDD211 pKa = 3.39SDD213 pKa = 4.49VFEE216 pKa = 4.6TCDD219 pKa = 3.95ADD221 pKa = 3.74VAYY224 pKa = 9.41PPGVYY229 pKa = 9.95PIDD232 pKa = 3.88GSYY235 pKa = 9.18STFAQRR241 pKa = 11.84YY242 pKa = 4.82TGSYY246 pKa = 10.64SSGTTGAMVGYY257 pKa = 7.88TVGVTDD263 pKa = 4.48TPTAAQMTPSSSNCVTQSSLAGNNVDD289 pKa = 3.67VSATGVIEE297 pKa = 4.95DD298 pKa = 4.72NRR300 pKa = 11.84DD301 pKa = 3.36DD302 pKa = 5.91DD303 pKa = 4.89SDD305 pKa = 4.76SNSDD309 pKa = 3.6PDD311 pKa = 4.11SNKK314 pKa = 9.89SDD316 pKa = 3.38KK317 pKa = 11.34SNPDD321 pKa = 3.24GNDD324 pKa = 3.36GGSTGSGQTSANAGDD339 pKa = 4.41GDD341 pKa = 4.17SSATTFTGFATVSAIALAVLAIALL365 pKa = 4.06
MM1 pKa = 7.3VLLKK5 pKa = 9.84TATTLLAATAAYY17 pKa = 9.34AWNHH21 pKa = 5.09TASDD25 pKa = 4.22VIATGTMGTTNPPEE39 pKa = 3.92ATMGTEE45 pKa = 4.46LNQTSVARR53 pKa = 11.84LVSINSIDD61 pKa = 3.76DD62 pKa = 3.49FCFFGPKK69 pKa = 8.57EE70 pKa = 4.15ANVTIGDD77 pKa = 3.93TEE79 pKa = 4.47GEE81 pKa = 4.17QVAWCTKK88 pKa = 8.17PRR90 pKa = 11.84NNARR94 pKa = 11.84VIPDD98 pKa = 3.27GTITSTHH105 pKa = 5.23FVKK108 pKa = 10.2TPAYY112 pKa = 8.72VQVSGFGDD120 pKa = 3.53LTKK123 pKa = 10.41IGVKK127 pKa = 10.51DD128 pKa = 3.4GDD130 pKa = 3.85YY131 pKa = 11.16GGEE134 pKa = 4.16LDD136 pKa = 3.7PHH138 pKa = 6.59GATGDD143 pKa = 3.82GNPVGGNVTSDD154 pKa = 2.95IVNGTSTSYY163 pKa = 11.27AEE165 pKa = 3.67WMEE168 pKa = 4.58FISYY172 pKa = 9.35EE173 pKa = 3.97QFCIRR178 pKa = 11.84ICTASNDD185 pKa = 3.28TWGAPVMCEE194 pKa = 3.73HH195 pKa = 7.14KK196 pKa = 10.3LDD198 pKa = 3.69EE199 pKa = 4.55MGCGFVMPDD208 pKa = 3.64AGDD211 pKa = 3.39SDD213 pKa = 4.49VFEE216 pKa = 4.6TCDD219 pKa = 3.95ADD221 pKa = 3.74VAYY224 pKa = 9.41PPGVYY229 pKa = 9.95PIDD232 pKa = 3.88GSYY235 pKa = 9.18STFAQRR241 pKa = 11.84YY242 pKa = 4.82TGSYY246 pKa = 10.64SSGTTGAMVGYY257 pKa = 7.88TVGVTDD263 pKa = 4.48TPTAAQMTPSSSNCVTQSSLAGNNVDD289 pKa = 3.67VSATGVIEE297 pKa = 4.95DD298 pKa = 4.72NRR300 pKa = 11.84DD301 pKa = 3.36DD302 pKa = 5.91DD303 pKa = 4.89SDD305 pKa = 4.76SNSDD309 pKa = 3.6PDD311 pKa = 4.11SNKK314 pKa = 9.89SDD316 pKa = 3.38KK317 pKa = 11.34SNPDD321 pKa = 3.24GNDD324 pKa = 3.36GGSTGSGQTSANAGDD339 pKa = 4.41GDD341 pKa = 4.17SSATTFTGFATVSAIALAVLAIALL365 pKa = 4.06
Molecular weight: 37.69 kDa
Isoelectric point according different methods:
Protein with the highest isoelectric point:
>tr|R9AFR4|R9AFR4_WALI9 Uncharacterized protein OS=Wallemia ichthyophaga (strain EXF-994 / CBS 113033) OX=1299270 GN=J056_004385 PE=4 SV=1
MM1 pKa = 7.87PGNIPLFPTFTTLLNRR17 pKa = 11.84RR18 pKa = 11.84PTLPAISAIAASGLRR33 pKa = 11.84FGSRR37 pKa = 11.84GTDD40 pKa = 3.46YY41 pKa = 11.15QPSTRR46 pKa = 11.84KK47 pKa = 9.59RR48 pKa = 11.84KK49 pKa = 8.51RR50 pKa = 11.84TFGFLARR57 pKa = 11.84IRR59 pKa = 11.84SRR61 pKa = 11.84TGRR64 pKa = 11.84KK65 pKa = 8.96IISRR69 pKa = 11.84RR70 pKa = 11.84LKK72 pKa = 10.29KK73 pKa = 10.25GKK75 pKa = 10.45KK76 pKa = 9.46NMSHH80 pKa = 6.78
MM1 pKa = 7.87PGNIPLFPTFTTLLNRR17 pKa = 11.84RR18 pKa = 11.84PTLPAISAIAASGLRR33 pKa = 11.84FGSRR37 pKa = 11.84GTDD40 pKa = 3.46YY41 pKa = 11.15QPSTRR46 pKa = 11.84KK47 pKa = 9.59RR48 pKa = 11.84KK49 pKa = 8.51RR50 pKa = 11.84TFGFLARR57 pKa = 11.84IRR59 pKa = 11.84SRR61 pKa = 11.84TGRR64 pKa = 11.84KK65 pKa = 8.96IISRR69 pKa = 11.84RR70 pKa = 11.84LKK72 pKa = 10.29KK73 pKa = 10.25GKK75 pKa = 10.45KK76 pKa = 9.46NMSHH80 pKa = 6.78
Molecular weight: 9.06 kDa
Isoelectric point according different methods:
Peptides (in silico digests for buttom-up proteomics)
Below you can find in silico digests of the whole proteome with Trypsin, Chymotrypsin, Trypsin+LysC, LysN, ArgC proteases suitable for different mass spec machines.| Try ESI |
 |
|---|
| ChTry ESI |
 |
|---|
| ArgC ESI |
 |
|---|
| LysN ESI |
 |
|---|
| TryLysC ESI |
 |
|---|
| Try MALDI |
 |
|---|
| ChTry MALDI |
 |
|---|
| ArgC MALDI |
 |
|---|
| LysN MALDI |
 |
|---|
| TryLysC MALDI |
 |
|---|
| Try LTQ |
 |
|---|
| ChTry LTQ |
 |
|---|
| ArgC LTQ |
 |
|---|
| LysN LTQ |
 |
|---|
| TryLysC LTQ |
 |
|---|
| Try MSlow |
 |
|---|
| ChTry MSlow |
 |
|---|
| ArgC MSlow |
 |
|---|
| LysN MSlow |
 |
|---|
| TryLysC MSlow |
 |
|---|
| Try MShigh |
 |
|---|
| ChTry MShigh |
 |
|---|
| ArgC MShigh |
 |
|---|
| LysN MShigh |
 |
|---|
| TryLysC MShigh |
 |
|---|
General Statistics
Number of major isoforms |
Number of additional isoforms |
Number of all proteins |
Number of amino acids |
Min. Seq. Length |
Max. Seq. Length |
Avg. Seq. Length |
Avg. Mol. Weight |
|---|---|---|---|---|---|---|---|
0 |
2342023 |
32 |
4950 |
484.3 |
53.96 |
Amino acid frequency
Ala |
Cys |
Asp |
Glu |
Phe |
Gly |
His |
Ile |
Lys |
Leu |
|---|---|---|---|---|---|---|---|---|---|
7.508 ± 0.032 | 1.044 ± 0.013 |
6.212 ± 0.028 | 6.147 ± 0.033 |
3.605 ± 0.021 | 5.893 ± 0.031 |
2.745 ± 0.02 | 5.357 ± 0.026 |
5.839 ± 0.037 | 9.144 ± 0.039 |
Met |
Asn |
Gln |
Pro |
Arg |
Ser |
Thr |
Val |
Trp |
Tyr |
|---|---|---|---|---|---|---|---|---|---|
2.065 ± 0.012 | 4.804 ± 0.023 |
5.167 ± 0.033 | 4.513 ± 0.03 |
5.4 ± 0.026 | 8.983 ± 0.042 |
5.745 ± 0.017 | 5.902 ± 0.03 |
1.091 ± 0.011 | 2.835 ± 0.015 |
Most of the basic statistics you can see at this page can be downloaded from this CSV file
Proteome-pI is available under Creative Commons Attribution-NoDerivs license, for more details see here
| Reference: Kozlowski LP. Proteome-pI 2.0: Proteome Isoelectric Point Database Update. Nucleic Acids Res. 2021, doi: 10.1093/nar/gkab944 | Contact: Lukasz P. Kozlowski |
