Oceanicella actignis
Taxonomy: cellular organisms; Bacteria;
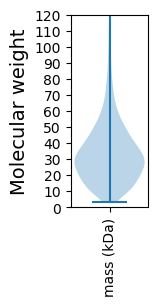
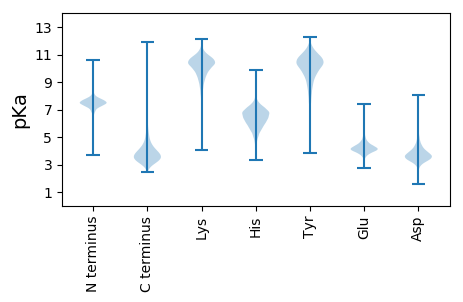
Average proteome isoelectric point is 6.83
Get precalculated fractions of proteins

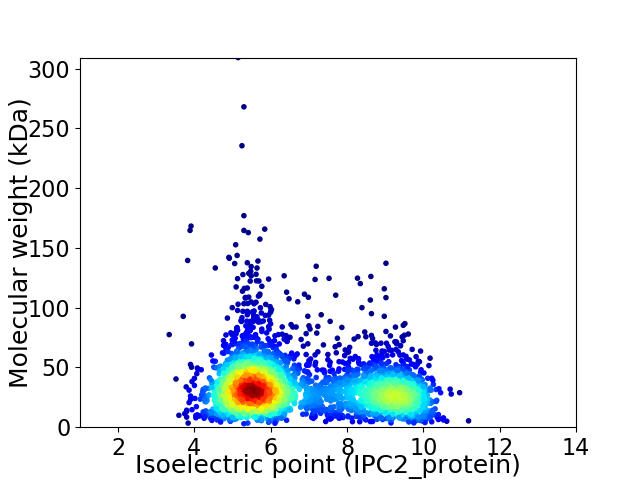
Virtual 2D-PAGE plot for 3013 proteins (isoelectric point calculated using IPC2_protein)
Get csv file with sequences according to given criteria:
* You can choose from 21 different methods for calculating isoelectric point
Summary statistics related to proteome-wise predictions


Protein with the lowest isoelectric point:
>tr|A0A1M7TKP1|A0A1M7TKP1_9RHOB Ureidoglycolate lyase OS=Oceanicella actignis OX=1189325 GN=SAMN05216200_107124 PE=4 SV=1
MM1 pKa = 7.47APKK4 pKa = 10.49AFALAALAALAAAPAGAGEE23 pKa = 4.4MFAGSYY29 pKa = 10.79DD30 pKa = 3.68GDD32 pKa = 3.46WLVRR36 pKa = 11.84VRR38 pKa = 11.84GIGVIPNEE46 pKa = 4.31SLTADD51 pKa = 5.37GIPGSDD57 pKa = 3.35ANITTSVVPEE67 pKa = 3.85LDD69 pKa = 2.56ITYY72 pKa = 9.74FFTPNIAAEE81 pKa = 4.99LILGTTPHH89 pKa = 6.84DD90 pKa = 3.9VSGRR94 pKa = 11.84GALAGADD101 pKa = 3.36IGSVWLLPPTLTLQYY116 pKa = 10.67HH117 pKa = 5.17VTQLGEE123 pKa = 4.05WTGSEE128 pKa = 4.05SLAKK132 pKa = 10.02VKK134 pKa = 10.18PYY136 pKa = 10.42FGAGVNYY143 pKa = 9.56TIFYY147 pKa = 10.76NEE149 pKa = 4.93DD150 pKa = 3.0AGQFNSIDD158 pKa = 3.51YY159 pKa = 11.05DD160 pKa = 3.85NAFGAALQAGVDD172 pKa = 3.83MEE174 pKa = 5.08LGDD177 pKa = 4.69GFYY180 pKa = 11.29LNADD184 pKa = 3.29VKK186 pKa = 11.02YY187 pKa = 10.76IFLEE191 pKa = 4.27TDD193 pKa = 2.68WSINDD198 pKa = 3.86GAITGSVDD206 pKa = 3.2INPLIVGLGLGYY218 pKa = 10.67RR219 pKa = 11.84FF220 pKa = 4.15
MM1 pKa = 7.47APKK4 pKa = 10.49AFALAALAALAAAPAGAGEE23 pKa = 4.4MFAGSYY29 pKa = 10.79DD30 pKa = 3.68GDD32 pKa = 3.46WLVRR36 pKa = 11.84VRR38 pKa = 11.84GIGVIPNEE46 pKa = 4.31SLTADD51 pKa = 5.37GIPGSDD57 pKa = 3.35ANITTSVVPEE67 pKa = 3.85LDD69 pKa = 2.56ITYY72 pKa = 9.74FFTPNIAAEE81 pKa = 4.99LILGTTPHH89 pKa = 6.84DD90 pKa = 3.9VSGRR94 pKa = 11.84GALAGADD101 pKa = 3.36IGSVWLLPPTLTLQYY116 pKa = 10.67HH117 pKa = 5.17VTQLGEE123 pKa = 4.05WTGSEE128 pKa = 4.05SLAKK132 pKa = 10.02VKK134 pKa = 10.18PYY136 pKa = 10.42FGAGVNYY143 pKa = 9.56TIFYY147 pKa = 10.76NEE149 pKa = 4.93DD150 pKa = 3.0AGQFNSIDD158 pKa = 3.51YY159 pKa = 11.05DD160 pKa = 3.85NAFGAALQAGVDD172 pKa = 3.83MEE174 pKa = 5.08LGDD177 pKa = 4.69GFYY180 pKa = 11.29LNADD184 pKa = 3.29VKK186 pKa = 11.02YY187 pKa = 10.76IFLEE191 pKa = 4.27TDD193 pKa = 2.68WSINDD198 pKa = 3.86GAITGSVDD206 pKa = 3.2INPLIVGLGLGYY218 pKa = 10.67RR219 pKa = 11.84FF220 pKa = 4.15
Molecular weight: 23.09 kDa
Isoelectric point according different methods:
Protein with the highest isoelectric point:
>tr|A0A1M7SQ62|A0A1M7SQ62_9RHOB Uncharacterized protein OS=Oceanicella actignis OX=1189325 GN=SAMN05216200_10396 PE=4 SV=1
MM1 pKa = 7.35KK2 pKa = 9.4RR3 pKa = 11.84TYY5 pKa = 10.2QPSRR9 pKa = 11.84LVRR12 pKa = 11.84KK13 pKa = 9.21RR14 pKa = 11.84RR15 pKa = 11.84HH16 pKa = 4.48GFRR19 pKa = 11.84ARR21 pKa = 11.84MATKK25 pKa = 10.37NGRR28 pKa = 11.84KK29 pKa = 9.03ILNARR34 pKa = 11.84RR35 pKa = 11.84ARR37 pKa = 11.84GRR39 pKa = 11.84KK40 pKa = 9.03RR41 pKa = 11.84LSAA44 pKa = 4.03
MM1 pKa = 7.35KK2 pKa = 9.4RR3 pKa = 11.84TYY5 pKa = 10.2QPSRR9 pKa = 11.84LVRR12 pKa = 11.84KK13 pKa = 9.21RR14 pKa = 11.84RR15 pKa = 11.84HH16 pKa = 4.48GFRR19 pKa = 11.84ARR21 pKa = 11.84MATKK25 pKa = 10.37NGRR28 pKa = 11.84KK29 pKa = 9.03ILNARR34 pKa = 11.84RR35 pKa = 11.84ARR37 pKa = 11.84GRR39 pKa = 11.84KK40 pKa = 9.03RR41 pKa = 11.84LSAA44 pKa = 4.03
Molecular weight: 5.31 kDa
Isoelectric point according different methods:
Peptides (in silico digests for buttom-up proteomics)
Below you can find in silico digests of the whole proteome with Trypsin, Chymotrypsin, Trypsin+LysC, LysN, ArgC proteases suitable for different mass spec machines.| Try ESI |
 |
|---|
| ChTry ESI |
 |
|---|
| ArgC ESI |
 |
|---|
| LysN ESI |
 |
|---|
| TryLysC ESI |
 |
|---|
| Try MALDI |
 |
|---|
| ChTry MALDI |
 |
|---|
| ArgC MALDI |
 |
|---|
| LysN MALDI |
 |
|---|
| TryLysC MALDI |
 |
|---|
| Try LTQ |
 |
|---|
| ChTry LTQ |
 |
|---|
| ArgC LTQ |
 |
|---|
| LysN LTQ |
 |
|---|
| TryLysC LTQ |
 |
|---|
| Try MSlow |
 |
|---|
| ChTry MSlow |
 |
|---|
| ArgC MSlow |
 |
|---|
| LysN MSlow |
 |
|---|
| TryLysC MSlow |
 |
|---|
| Try MShigh |
 |
|---|
| ChTry MShigh |
 |
|---|
| ArgC MShigh |
 |
|---|
| LysN MShigh |
 |
|---|
| TryLysC MShigh |
 |
|---|
General Statistics
Number of major isoforms |
Number of additional isoforms |
Number of all proteins |
Number of amino acids |
Min. Seq. Length |
Max. Seq. Length |
Avg. Seq. Length |
Avg. Mol. Weight |
|---|---|---|---|---|---|---|---|
0 |
998641 |
29 |
2959 |
331.4 |
35.6 |
Amino acid frequency
Ala |
Cys |
Asp |
Glu |
Phe |
Gly |
His |
Ile |
Lys |
Leu |
|---|---|---|---|---|---|---|---|---|---|
16.458 ± 0.098 | 0.839 ± 0.013 |
5.599 ± 0.037 | 6.292 ± 0.043 |
3.317 ± 0.024 | 9.007 ± 0.048 |
1.852 ± 0.021 | 4.135 ± 0.032 |
2.259 ± 0.035 | 10.326 ± 0.049 |
Met |
Asn |
Gln |
Pro |
Arg |
Ser |
Thr |
Val |
Trp |
Tyr |
|---|---|---|---|---|---|---|---|---|---|
2.485 ± 0.021 | 1.834 ± 0.021 |
6.136 ± 0.042 | 2.475 ± 0.021 |
9.083 ± 0.054 | 4.016 ± 0.025 |
4.038 ± 0.028 | 6.655 ± 0.033 |
1.44 ± 0.021 | 1.754 ± 0.021 |
Most of the basic statistics you can see at this page can be downloaded from this CSV file
Proteome-pI is available under Creative Commons Attribution-NoDerivs license, for more details see here
| Reference: Kozlowski LP. Proteome-pI 2.0: Proteome Isoelectric Point Database Update. Nucleic Acids Res. 2021, doi: 10.1093/nar/gkab944 | Contact: Lukasz P. Kozlowski |
