Friedmanniomyces endolithicus
Taxonomy: cellular organisms; Eukaryota; Opisthokonta; Fungi; Dikarya; Ascomycota; saccharomyceta; Pezizomycotina; leotiomyceta; dothideomyceta; Dothideomycetes; Dothideomycetidae; Mycosphaerellales; Teratosphaeriaceae; Friedmanniomyces
Average proteome isoelectric point is 6.43
Get precalculated fractions of proteins

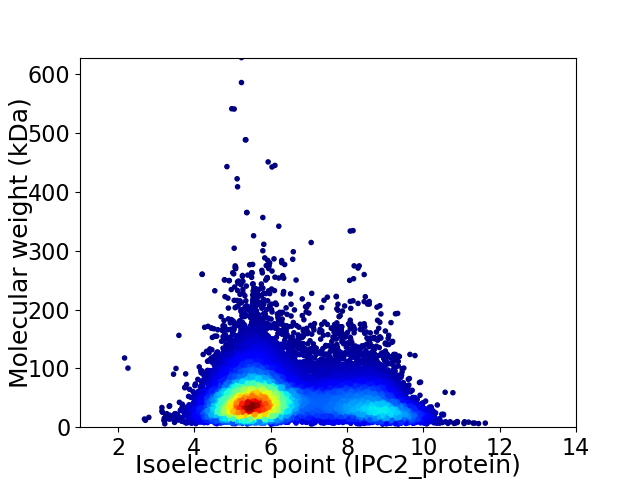
Virtual 2D-PAGE plot for 17901 proteins (isoelectric point calculated using IPC2_protein)
Get csv file with sequences according to given criteria:
* You can choose from 21 different methods for calculating isoelectric point
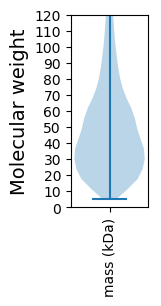
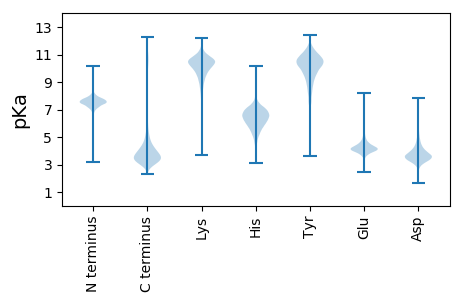
Summary statistics related to proteome-wise predictions


Protein with the lowest isoelectric point:
>tr|A0A4U0TTZ6|A0A4U0TTZ6_9PEZI Uncharacterized protein OS=Friedmanniomyces endolithicus OX=329885 GN=B0A54_17344 PE=4 SV=1
MM1 pKa = 7.43SVATLVRR8 pKa = 11.84LLCTAQLVLAASTGVGDD25 pKa = 4.1VVASAIGLTKK35 pKa = 10.7SLTATSASVQTTPSITPTPALKK57 pKa = 10.85YY58 pKa = 10.44NSFGNSSSDD67 pKa = 2.96ACYY70 pKa = 10.06TSWLGYY76 pKa = 9.09WSVSRR81 pKa = 11.84SALALSLSLYY91 pKa = 10.14NSSILGTTTWTSKK104 pKa = 10.55ISVPAQAQSTNTQYY118 pKa = 10.12DD119 pKa = 3.82TLDD122 pKa = 3.36EE123 pKa = 4.41TVYY126 pKa = 11.55SMDD129 pKa = 3.27GAFTISTQTIDD140 pKa = 3.36TTEE143 pKa = 3.98EE144 pKa = 4.55VYY146 pKa = 9.17VTYY149 pKa = 10.62QSEE152 pKa = 4.15NASTYY157 pKa = 7.59TQIQTFTEE165 pKa = 3.98VTYY168 pKa = 10.22FKK170 pKa = 11.1SNVSVPPTPTYY181 pKa = 10.72DD182 pKa = 3.41PPKK185 pKa = 10.42ALTAVSSAAQVTVPLSSSATAAATPGSSPSQPATEE220 pKa = 4.3TSQASTGEE228 pKa = 4.06DD229 pKa = 3.42TLPSSSSQASSPIAQSSQTSSSQDD253 pKa = 3.18PGGVIVSVLGASDD266 pKa = 3.6SSSAQGSQSPTGTSNGAKK284 pKa = 9.92SQLQYY289 pKa = 11.43SSDD292 pKa = 3.69STSSQDD298 pKa = 3.06AGRR301 pKa = 11.84VTVSTPGASDD311 pKa = 3.3SGSVRR316 pKa = 11.84GSQTPTGTSNGAQSQLQYY334 pKa = 11.29SSDD337 pKa = 3.74STSSQDD343 pKa = 3.31PGRR346 pKa = 11.84VTVSTPGASDD356 pKa = 3.56SNSVQGGQSPTGGAQSQPQDD376 pKa = 3.4SSDD379 pKa = 3.72PNSTQSIGIVLASIFGGGTGSSGVEE404 pKa = 3.75SSLVPTEE411 pKa = 4.24NGGDD415 pKa = 3.68PGNSAIAAGQTAVSTLAIGTASGIQIGAVIASGEE449 pKa = 4.34SIEE452 pKa = 4.24TLATGGPAVPQGGQQLTAEE471 pKa = 4.49LTNAVTVIGTGADD484 pKa = 3.14ATFVATAPTDD494 pKa = 3.76PPLVTIGSQIFTLSSLGSTGGVLVDD519 pKa = 4.03QGTTLTTGSDD529 pKa = 3.29ASVVTVDD536 pKa = 3.55GQTVRR541 pKa = 11.84AGPSGEE547 pKa = 4.31VIVGSSILTLPLSTTFIATASTDD570 pKa = 3.58QPVVTIGSQVLTLSSLSGGTGQLLADD596 pKa = 3.85QEE598 pKa = 4.86TTVTIGPDD606 pKa = 3.48GSVVTVDD613 pKa = 3.47GQTVHH618 pKa = 7.16AGPSGEE624 pKa = 4.84LIVGSSTLNLPSGSSASDD642 pKa = 3.31ASPAITNAKK651 pKa = 9.67SSEE654 pKa = 3.98SSAPSGTTPITSGSSALKK672 pKa = 10.29KK673 pKa = 10.23QATTEE678 pKa = 4.08ALCLAIVFACVQALLL693 pKa = 4.11
MM1 pKa = 7.43SVATLVRR8 pKa = 11.84LLCTAQLVLAASTGVGDD25 pKa = 4.1VVASAIGLTKK35 pKa = 10.7SLTATSASVQTTPSITPTPALKK57 pKa = 10.85YY58 pKa = 10.44NSFGNSSSDD67 pKa = 2.96ACYY70 pKa = 10.06TSWLGYY76 pKa = 9.09WSVSRR81 pKa = 11.84SALALSLSLYY91 pKa = 10.14NSSILGTTTWTSKK104 pKa = 10.55ISVPAQAQSTNTQYY118 pKa = 10.12DD119 pKa = 3.82TLDD122 pKa = 3.36EE123 pKa = 4.41TVYY126 pKa = 11.55SMDD129 pKa = 3.27GAFTISTQTIDD140 pKa = 3.36TTEE143 pKa = 3.98EE144 pKa = 4.55VYY146 pKa = 9.17VTYY149 pKa = 10.62QSEE152 pKa = 4.15NASTYY157 pKa = 7.59TQIQTFTEE165 pKa = 3.98VTYY168 pKa = 10.22FKK170 pKa = 11.1SNVSVPPTPTYY181 pKa = 10.72DD182 pKa = 3.41PPKK185 pKa = 10.42ALTAVSSAAQVTVPLSSSATAAATPGSSPSQPATEE220 pKa = 4.3TSQASTGEE228 pKa = 4.06DD229 pKa = 3.42TLPSSSSQASSPIAQSSQTSSSQDD253 pKa = 3.18PGGVIVSVLGASDD266 pKa = 3.6SSSAQGSQSPTGTSNGAKK284 pKa = 9.92SQLQYY289 pKa = 11.43SSDD292 pKa = 3.69STSSQDD298 pKa = 3.06AGRR301 pKa = 11.84VTVSTPGASDD311 pKa = 3.3SGSVRR316 pKa = 11.84GSQTPTGTSNGAQSQLQYY334 pKa = 11.29SSDD337 pKa = 3.74STSSQDD343 pKa = 3.31PGRR346 pKa = 11.84VTVSTPGASDD356 pKa = 3.56SNSVQGGQSPTGGAQSQPQDD376 pKa = 3.4SSDD379 pKa = 3.72PNSTQSIGIVLASIFGGGTGSSGVEE404 pKa = 3.75SSLVPTEE411 pKa = 4.24NGGDD415 pKa = 3.68PGNSAIAAGQTAVSTLAIGTASGIQIGAVIASGEE449 pKa = 4.34SIEE452 pKa = 4.24TLATGGPAVPQGGQQLTAEE471 pKa = 4.49LTNAVTVIGTGADD484 pKa = 3.14ATFVATAPTDD494 pKa = 3.76PPLVTIGSQIFTLSSLGSTGGVLVDD519 pKa = 4.03QGTTLTTGSDD529 pKa = 3.29ASVVTVDD536 pKa = 3.55GQTVRR541 pKa = 11.84AGPSGEE547 pKa = 4.31VIVGSSILTLPLSTTFIATASTDD570 pKa = 3.58QPVVTIGSQVLTLSSLSGGTGQLLADD596 pKa = 3.85QEE598 pKa = 4.86TTVTIGPDD606 pKa = 3.48GSVVTVDD613 pKa = 3.47GQTVHH618 pKa = 7.16AGPSGEE624 pKa = 4.84LIVGSSTLNLPSGSSASDD642 pKa = 3.31ASPAITNAKK651 pKa = 9.67SSEE654 pKa = 3.98SSAPSGTTPITSGSSALKK672 pKa = 10.29KK673 pKa = 10.23QATTEE678 pKa = 4.08ALCLAIVFACVQALLL693 pKa = 4.11
Molecular weight: 68.29 kDa
Isoelectric point according different methods:
Protein with the highest isoelectric point:
>tr|A0A4U0UMV1|A0A4U0UMV1_9PEZI FolB domain-containing protein OS=Friedmanniomyces endolithicus OX=329885 GN=B0A54_12012 PE=4 SV=1
MM1 pKa = 7.66RR2 pKa = 11.84NDD4 pKa = 2.91AGLRR8 pKa = 11.84GRR10 pKa = 11.84VRR12 pKa = 11.84VRR14 pKa = 11.84VRR16 pKa = 11.84VRR18 pKa = 11.84VRR20 pKa = 11.84VRR22 pKa = 11.84VRR24 pKa = 11.84VRR26 pKa = 11.84VRR28 pKa = 11.84VRR30 pKa = 11.84VRR32 pKa = 11.84VRR34 pKa = 11.84VRR36 pKa = 11.84VRR38 pKa = 11.84VRR40 pKa = 11.84VRR42 pKa = 11.84VRR44 pKa = 11.84VRR46 pKa = 11.84VRR48 pKa = 11.84VRR50 pKa = 11.84VRR52 pKa = 11.84VRR54 pKa = 11.84VRR56 pKa = 2.89
MM1 pKa = 7.66RR2 pKa = 11.84NDD4 pKa = 2.91AGLRR8 pKa = 11.84GRR10 pKa = 11.84VRR12 pKa = 11.84VRR14 pKa = 11.84VRR16 pKa = 11.84VRR18 pKa = 11.84VRR20 pKa = 11.84VRR22 pKa = 11.84VRR24 pKa = 11.84VRR26 pKa = 11.84VRR28 pKa = 11.84VRR30 pKa = 11.84VRR32 pKa = 11.84VRR34 pKa = 11.84VRR36 pKa = 11.84VRR38 pKa = 11.84VRR40 pKa = 11.84VRR42 pKa = 11.84VRR44 pKa = 11.84VRR46 pKa = 11.84VRR48 pKa = 11.84VRR50 pKa = 11.84VRR52 pKa = 11.84VRR54 pKa = 11.84VRR56 pKa = 2.89
Molecular weight: 7.02 kDa
Isoelectric point according different methods:
Peptides (in silico digests for buttom-up proteomics)
Below you can find in silico digests of the whole proteome with Trypsin, Chymotrypsin, Trypsin+LysC, LysN, ArgC proteases suitable for different mass spec machines.| Try ESI |
 |
|---|
| ChTry ESI |
 |
|---|
| ArgC ESI |
 |
|---|
| LysN ESI |
 |
|---|
| TryLysC ESI |
 |
|---|
| Try MALDI |
 |
|---|
| ChTry MALDI |
 |
|---|
| ArgC MALDI |
 |
|---|
| LysN MALDI |
 |
|---|
| TryLysC MALDI |
 |
|---|
| Try LTQ |
 |
|---|
| ChTry LTQ |
 |
|---|
| ArgC LTQ |
 |
|---|
| LysN LTQ |
 |
|---|
| TryLysC LTQ |
 |
|---|
| Try MSlow |
 |
|---|
| ChTry MSlow |
 |
|---|
| ArgC MSlow |
 |
|---|
| LysN MSlow |
 |
|---|
| TryLysC MSlow |
 |
|---|
| Try MShigh |
 |
|---|
| ChTry MShigh |
 |
|---|
| ArgC MShigh |
 |
|---|
| LysN MShigh |
 |
|---|
| TryLysC MShigh |
 |
|---|
General Statistics
Number of major isoforms |
Number of additional isoforms |
Number of all proteins |
Number of amino acids |
Min. Seq. Length |
Max. Seq. Length |
Avg. Seq. Length |
Avg. Mol. Weight |
|---|---|---|---|---|---|---|---|
0 |
8776224 |
51 |
5763 |
490.3 |
53.85 |
Amino acid frequency
Ala |
Cys |
Asp |
Glu |
Phe |
Gly |
His |
Ile |
Lys |
Leu |
|---|---|---|---|---|---|---|---|---|---|
9.625 ± 0.018 | 1.087 ± 0.007 |
5.667 ± 0.013 | 6.393 ± 0.018 |
3.338 ± 0.01 | 7.578 ± 0.018 |
2.437 ± 0.008 | 4.179 ± 0.011 |
4.551 ± 0.016 | 8.703 ± 0.018 |
Met |
Asn |
Gln |
Pro |
Arg |
Ser |
Thr |
Val |
Trp |
Tyr |
|---|---|---|---|---|---|---|---|---|---|
2.283 ± 0.008 | 3.252 ± 0.01 |
6.095 ± 0.019 | 4.166 ± 0.013 |
6.421 ± 0.018 | 7.804 ± 0.021 |
6.117 ± 0.015 | 6.277 ± 0.013 |
1.361 ± 0.006 | 2.666 ± 0.01 |
Most of the basic statistics you can see at this page can be downloaded from this CSV file
Proteome-pI is available under Creative Commons Attribution-NoDerivs license, for more details see here
| Reference: Kozlowski LP. Proteome-pI 2.0: Proteome Isoelectric Point Database Update. Nucleic Acids Res. 2021, doi: 10.1093/nar/gkab944 | Contact: Lukasz P. Kozlowski |
