Bifidobacterium cuniculi
Taxonomy: cellular organisms; Bacteria; Terrabacteria group; Actinobacteria; Actinomycetia; Bifidobacteriales; Bifidobacteriaceae; Bifidobacterium
Average proteome isoelectric point is 5.97
Get precalculated fractions of proteins

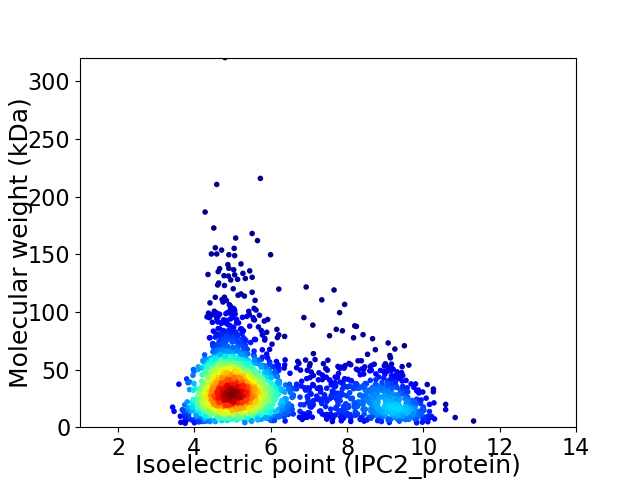
Virtual 2D-PAGE plot for 2189 proteins (isoelectric point calculated using IPC2_protein)
Get csv file with sequences according to given criteria:
* You can choose from 21 different methods for calculating isoelectric point
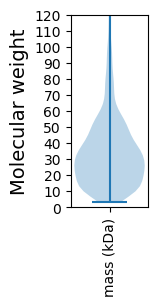
Summary statistics related to proteome-wise predictions


Protein with the lowest isoelectric point:
>tr|A0A087AKI5|A0A087AKI5_9BIFI Transposase for IS3509a (Fragment) OS=Bifidobacterium cuniculi OX=1688 GN=BCUN_1626 PE=4 SV=1
MM1 pKa = 7.61SNPYY5 pKa = 10.96DD6 pKa = 3.82NGTQSTPSNPYY17 pKa = 8.23QSSPVPHH24 pKa = 7.07ANDD27 pKa = 4.78DD28 pKa = 3.85NTSAPQQFPSQLNYY42 pKa = 10.02GQSAVPDD49 pKa = 3.57ATQAFPAPGRR59 pKa = 11.84TVPVDD64 pKa = 3.14ATQPLTGTGQQPFPYY79 pKa = 9.34GGQPAPTYY87 pKa = 8.33GQPPADD93 pKa = 4.33PTQAMPPYY101 pKa = 8.54GQPPAGAYY109 pKa = 8.36PGQPGQPQVVQSGQGQEE126 pKa = 3.97QPTTEE131 pKa = 3.9LSGYY135 pKa = 7.61GQPQYY140 pKa = 11.06GQQPQYY146 pKa = 11.41GQMPPQIPPQNGYY159 pKa = 9.8EE160 pKa = 4.08PQPGGAPKK168 pKa = 10.3KK169 pKa = 9.47KK170 pKa = 9.87LHH172 pKa = 6.75PGVIAGVIVAAVVAIALIVWGIIALTGNDD201 pKa = 4.17DD202 pKa = 4.02AKK204 pKa = 11.2ADD206 pKa = 3.9PTASPSVSSSVPATSDD222 pKa = 3.41PAPSPKK228 pKa = 9.4TDD230 pKa = 3.49PTDD233 pKa = 3.62EE234 pKa = 4.34PTTDD238 pKa = 3.21IDD240 pKa = 6.15DD241 pKa = 4.45PFEE244 pKa = 5.89DD245 pKa = 5.42LDD247 pKa = 6.21DD248 pKa = 5.52DD249 pKa = 4.27LTGDD253 pKa = 3.71TLEE256 pKa = 5.7DD257 pKa = 3.81FLKK260 pKa = 9.97LTNADD265 pKa = 3.48EE266 pKa = 4.54EE267 pKa = 4.41FAKK270 pKa = 10.89LSDD273 pKa = 3.71QMPDD277 pKa = 3.37GVNMDD282 pKa = 3.94IYY284 pKa = 10.95ATGNTLVFDD293 pKa = 4.82LALDD297 pKa = 4.25DD298 pKa = 4.46FTGSTADD305 pKa = 3.46MMSDD309 pKa = 3.14MLVEE313 pKa = 4.01EE314 pKa = 5.28LEE316 pKa = 4.61PEE318 pKa = 4.31LKK320 pKa = 10.32EE321 pKa = 4.22QAGEE325 pKa = 4.06MQEE328 pKa = 4.14MFPDD332 pKa = 3.39AAMQLKK338 pKa = 10.09IVDD341 pKa = 3.98GDD343 pKa = 3.77GKK345 pKa = 8.64TLYY348 pKa = 10.94NEE350 pKa = 4.31TYY352 pKa = 10.26KK353 pKa = 11.1
MM1 pKa = 7.61SNPYY5 pKa = 10.96DD6 pKa = 3.82NGTQSTPSNPYY17 pKa = 8.23QSSPVPHH24 pKa = 7.07ANDD27 pKa = 4.78DD28 pKa = 3.85NTSAPQQFPSQLNYY42 pKa = 10.02GQSAVPDD49 pKa = 3.57ATQAFPAPGRR59 pKa = 11.84TVPVDD64 pKa = 3.14ATQPLTGTGQQPFPYY79 pKa = 9.34GGQPAPTYY87 pKa = 8.33GQPPADD93 pKa = 4.33PTQAMPPYY101 pKa = 8.54GQPPAGAYY109 pKa = 8.36PGQPGQPQVVQSGQGQEE126 pKa = 3.97QPTTEE131 pKa = 3.9LSGYY135 pKa = 7.61GQPQYY140 pKa = 11.06GQQPQYY146 pKa = 11.41GQMPPQIPPQNGYY159 pKa = 9.8EE160 pKa = 4.08PQPGGAPKK168 pKa = 10.3KK169 pKa = 9.47KK170 pKa = 9.87LHH172 pKa = 6.75PGVIAGVIVAAVVAIALIVWGIIALTGNDD201 pKa = 4.17DD202 pKa = 4.02AKK204 pKa = 11.2ADD206 pKa = 3.9PTASPSVSSSVPATSDD222 pKa = 3.41PAPSPKK228 pKa = 9.4TDD230 pKa = 3.49PTDD233 pKa = 3.62EE234 pKa = 4.34PTTDD238 pKa = 3.21IDD240 pKa = 6.15DD241 pKa = 4.45PFEE244 pKa = 5.89DD245 pKa = 5.42LDD247 pKa = 6.21DD248 pKa = 5.52DD249 pKa = 4.27LTGDD253 pKa = 3.71TLEE256 pKa = 5.7DD257 pKa = 3.81FLKK260 pKa = 9.97LTNADD265 pKa = 3.48EE266 pKa = 4.54EE267 pKa = 4.41FAKK270 pKa = 10.89LSDD273 pKa = 3.71QMPDD277 pKa = 3.37GVNMDD282 pKa = 3.94IYY284 pKa = 10.95ATGNTLVFDD293 pKa = 4.82LALDD297 pKa = 4.25DD298 pKa = 4.46FTGSTADD305 pKa = 3.46MMSDD309 pKa = 3.14MLVEE313 pKa = 4.01EE314 pKa = 5.28LEE316 pKa = 4.61PEE318 pKa = 4.31LKK320 pKa = 10.32EE321 pKa = 4.22QAGEE325 pKa = 4.06MQEE328 pKa = 4.14MFPDD332 pKa = 3.39AAMQLKK338 pKa = 10.09IVDD341 pKa = 3.98GDD343 pKa = 3.77GKK345 pKa = 8.64TLYY348 pKa = 10.94NEE350 pKa = 4.31TYY352 pKa = 10.26KK353 pKa = 11.1
Molecular weight: 37.3 kDa
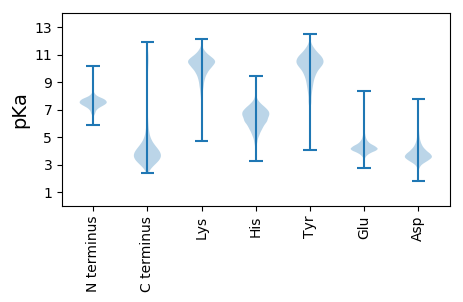
Isoelectric point according different methods:
Protein with the highest isoelectric point:
>tr|A0A087ANE0|A0A087ANE0_9BIFI Oxidoreductase OS=Bifidobacterium cuniculi OX=1688 GN=BCUN_1454 PE=4 SV=1
MM1 pKa = 7.44KK2 pKa = 9.6RR3 pKa = 11.84TFQPNNRR10 pKa = 11.84RR11 pKa = 11.84RR12 pKa = 11.84HH13 pKa = 4.79MKK15 pKa = 9.36HH16 pKa = 5.81GFRR19 pKa = 11.84ARR21 pKa = 11.84MRR23 pKa = 11.84TRR25 pKa = 11.84SGRR28 pKa = 11.84ALINRR33 pKa = 11.84RR34 pKa = 11.84RR35 pKa = 11.84AKK37 pKa = 10.1GRR39 pKa = 11.84KK40 pKa = 6.57TLAAA44 pKa = 4.49
MM1 pKa = 7.44KK2 pKa = 9.6RR3 pKa = 11.84TFQPNNRR10 pKa = 11.84RR11 pKa = 11.84RR12 pKa = 11.84HH13 pKa = 4.79MKK15 pKa = 9.36HH16 pKa = 5.81GFRR19 pKa = 11.84ARR21 pKa = 11.84MRR23 pKa = 11.84TRR25 pKa = 11.84SGRR28 pKa = 11.84ALINRR33 pKa = 11.84RR34 pKa = 11.84RR35 pKa = 11.84AKK37 pKa = 10.1GRR39 pKa = 11.84KK40 pKa = 6.57TLAAA44 pKa = 4.49
Molecular weight: 5.35 kDa
Isoelectric point according different methods:
Peptides (in silico digests for buttom-up proteomics)
Below you can find in silico digests of the whole proteome with Trypsin, Chymotrypsin, Trypsin+LysC, LysN, ArgC proteases suitable for different mass spec machines.| Try ESI |
 |
|---|
| ChTry ESI |
 |
|---|
| ArgC ESI |
 |
|---|
| LysN ESI |
 |
|---|
| TryLysC ESI |
 |
|---|
| Try MALDI |
 |
|---|
| ChTry MALDI |
 |
|---|
| ArgC MALDI |
 |
|---|
| LysN MALDI |
 |
|---|
| TryLysC MALDI |
 |
|---|
| Try LTQ |
 |
|---|
| ChTry LTQ |
 |
|---|
| ArgC LTQ |
 |
|---|
| LysN LTQ |
 |
|---|
| TryLysC LTQ |
 |
|---|
| Try MSlow |
 |
|---|
| ChTry MSlow |
 |
|---|
| ArgC MSlow |
 |
|---|
| LysN MSlow |
 |
|---|
| TryLysC MSlow |
 |
|---|
| Try MShigh |
 |
|---|
| ChTry MShigh |
 |
|---|
| ArgC MShigh |
 |
|---|
| LysN MShigh |
 |
|---|
| TryLysC MShigh |
 |
|---|
General Statistics
Number of major isoforms |
Number of additional isoforms |
Number of all proteins |
Number of amino acids |
Min. Seq. Length |
Max. Seq. Length |
Avg. Seq. Length |
Avg. Mol. Weight |
|---|---|---|---|---|---|---|---|
0 |
724817 |
33 |
3027 |
331.1 |
36.17 |
Amino acid frequency
Ala |
Cys |
Asp |
Glu |
Phe |
Gly |
His |
Ile |
Lys |
Leu |
|---|---|---|---|---|---|---|---|---|---|
11.481 ± 0.084 | 1.044 ± 0.018 |
7.067 ± 0.048 | 5.654 ± 0.056 |
3.147 ± 0.03 | 8.087 ± 0.047 |
2.337 ± 0.028 | 4.652 ± 0.039 |
3.219 ± 0.045 | 8.922 ± 0.053 |
Met |
Asn |
Gln |
Pro |
Arg |
Ser |
Thr |
Val |
Trp |
Tyr |
|---|---|---|---|---|---|---|---|---|---|
2.793 ± 0.026 | 2.813 ± 0.035 |
4.873 ± 0.037 | 3.72 ± 0.034 |
6.654 ± 0.06 | 5.29 ± 0.038 |
6.164 ± 0.049 | 7.944 ± 0.052 |
1.477 ± 0.02 | 2.661 ± 0.03 |
Most of the basic statistics you can see at this page can be downloaded from this CSV file
Proteome-pI is available under Creative Commons Attribution-NoDerivs license, for more details see here
| Reference: Kozlowski LP. Proteome-pI 2.0: Proteome Isoelectric Point Database Update. Nucleic Acids Res. 2021, doi: 10.1093/nar/gkab944 | Contact: Lukasz P. Kozlowski |
