Rutstroemia sp. NJR-2017a BBW
Taxonomy: cellular organisms; Eukaryota; Opisthokonta; Fungi; Dikarya; Ascomycota; saccharomyceta; Pezizomycotina; leotiomyceta; sordariomyceta; Leotiomycetes; Helotiales; Rutstroemiaceae; Rutstroemia; unclassified Rutstroemia
Average proteome isoelectric point is 6.47
Get precalculated fractions of proteins

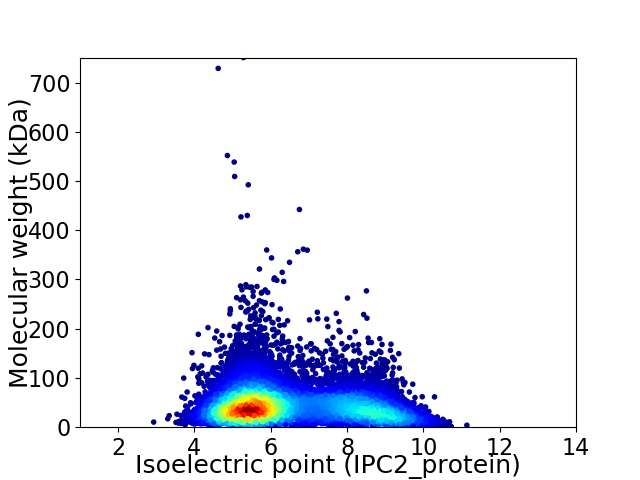
Virtual 2D-PAGE plot for 10779 proteins (isoelectric point calculated using IPC2_protein)
Get csv file with sequences according to given criteria:
* You can choose from 21 different methods for calculating isoelectric point
Summary statistics related to proteome-wise predictions


Protein with the lowest isoelectric point:
>tr|A0A2S7PF64|A0A2S7PF64_9HELO Uncharacterized protein OS=Rutstroemia sp. NJR-2017a BBW OX=2070414 GN=CJF30_00002829 PE=4 SV=1
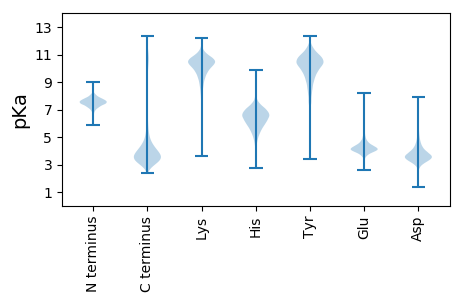
MM1 pKa = 7.76SDD3 pKa = 4.24FAPPSGPPPPKK14 pKa = 10.39VPAGYY19 pKa = 9.74KK20 pKa = 10.17AVWNDD25 pKa = 3.49QYY27 pKa = 12.14NEE29 pKa = 3.64WFYY32 pKa = 11.95VNIYY36 pKa = 7.43TKK38 pKa = 10.66KK39 pKa = 9.12STWDD43 pKa = 3.24KK44 pKa = 9.15PTEE47 pKa = 4.03PVYY50 pKa = 10.5PPSDD54 pKa = 3.7EE55 pKa = 4.86APPAGPPPSYY65 pKa = 10.74GPSGSNSHH73 pKa = 6.34SPYY76 pKa = 9.5PTDD79 pKa = 3.47TKK81 pKa = 11.24SNPYY85 pKa = 8.37DD86 pKa = 3.36THH88 pKa = 6.6PSNNVEE94 pKa = 3.85SDD96 pKa = 3.03AALAARR102 pKa = 11.84LQAEE106 pKa = 3.96EE107 pKa = 4.29DD108 pKa = 3.49ARR110 pKa = 11.84AGSSSSGNRR119 pKa = 11.84NAMQDD124 pKa = 3.77YY125 pKa = 10.46QNTPMPQGSGSSSIQDD141 pKa = 3.3HH142 pKa = 6.23DD143 pKa = 3.8QEE145 pKa = 5.14EE146 pKa = 4.6YY147 pKa = 9.35QQGYY151 pKa = 9.33DD152 pKa = 4.25AGQNDD157 pKa = 4.25DD158 pKa = 4.61GGDD161 pKa = 3.41FGGDD165 pKa = 3.36DD166 pKa = 4.09GGDD169 pKa = 3.33FF170 pKa = 4.33
MM1 pKa = 7.76SDD3 pKa = 4.24FAPPSGPPPPKK14 pKa = 10.39VPAGYY19 pKa = 9.74KK20 pKa = 10.17AVWNDD25 pKa = 3.49QYY27 pKa = 12.14NEE29 pKa = 3.64WFYY32 pKa = 11.95VNIYY36 pKa = 7.43TKK38 pKa = 10.66KK39 pKa = 9.12STWDD43 pKa = 3.24KK44 pKa = 9.15PTEE47 pKa = 4.03PVYY50 pKa = 10.5PPSDD54 pKa = 3.7EE55 pKa = 4.86APPAGPPPSYY65 pKa = 10.74GPSGSNSHH73 pKa = 6.34SPYY76 pKa = 9.5PTDD79 pKa = 3.47TKK81 pKa = 11.24SNPYY85 pKa = 8.37DD86 pKa = 3.36THH88 pKa = 6.6PSNNVEE94 pKa = 3.85SDD96 pKa = 3.03AALAARR102 pKa = 11.84LQAEE106 pKa = 3.96EE107 pKa = 4.29DD108 pKa = 3.49ARR110 pKa = 11.84AGSSSSGNRR119 pKa = 11.84NAMQDD124 pKa = 3.77YY125 pKa = 10.46QNTPMPQGSGSSSIQDD141 pKa = 3.3HH142 pKa = 6.23DD143 pKa = 3.8QEE145 pKa = 5.14EE146 pKa = 4.6YY147 pKa = 9.35QQGYY151 pKa = 9.33DD152 pKa = 4.25AGQNDD157 pKa = 4.25DD158 pKa = 4.61GGDD161 pKa = 3.41FGGDD165 pKa = 3.36DD166 pKa = 4.09GGDD169 pKa = 3.33FF170 pKa = 4.33
Molecular weight: 18.24 kDa
Isoelectric point according different methods:
Protein with the highest isoelectric point:
>tr|A0A2S7PJT5|A0A2S7PJT5_9HELO Ubiquitin carboxyl-terminal hydrolase family 1 protein OS=Rutstroemia sp. NJR-2017a BBW OX=2070414 GN=CJF30_00007136 PE=4 SV=1
MM1 pKa = 7.36GVRR4 pKa = 11.84RR5 pKa = 11.84KK6 pKa = 10.15KK7 pKa = 10.58LLRR10 pKa = 11.84QSRR13 pKa = 11.84LRR15 pKa = 11.84PLIHH19 pKa = 6.71HH20 pKa = 7.18RR21 pKa = 11.84SPHH24 pKa = 4.24QRR26 pKa = 11.84KK27 pKa = 8.76ARR29 pKa = 11.84APARR33 pKa = 3.79
MM1 pKa = 7.36GVRR4 pKa = 11.84RR5 pKa = 11.84KK6 pKa = 10.15KK7 pKa = 10.58LLRR10 pKa = 11.84QSRR13 pKa = 11.84LRR15 pKa = 11.84PLIHH19 pKa = 6.71HH20 pKa = 7.18RR21 pKa = 11.84SPHH24 pKa = 4.24QRR26 pKa = 11.84KK27 pKa = 8.76ARR29 pKa = 11.84APARR33 pKa = 3.79
Molecular weight: 4.01 kDa
Isoelectric point according different methods:
Peptides (in silico digests for buttom-up proteomics)
Below you can find in silico digests of the whole proteome with Trypsin, Chymotrypsin, Trypsin+LysC, LysN, ArgC proteases suitable for different mass spec machines.| Try ESI |
 |
|---|
| ChTry ESI |
 |
|---|
| ArgC ESI |
 |
|---|
| LysN ESI |
 |
|---|
| TryLysC ESI |
 |
|---|
| Try MALDI |
 |
|---|
| ChTry MALDI |
 |
|---|
| ArgC MALDI |
 |
|---|
| LysN MALDI |
 |
|---|
| TryLysC MALDI |
 |
|---|
| Try LTQ |
 |
|---|
| ChTry LTQ |
 |
|---|
| ArgC LTQ |
 |
|---|
| LysN LTQ |
 |
|---|
| TryLysC LTQ |
 |
|---|
| Try MSlow |
 |
|---|
| ChTry MSlow |
 |
|---|
| ArgC MSlow |
 |
|---|
| LysN MSlow |
 |
|---|
| TryLysC MSlow |
 |
|---|
| Try MShigh |
 |
|---|
| ChTry MShigh |
 |
|---|
| ArgC MShigh |
 |
|---|
| LysN MShigh |
 |
|---|
| TryLysC MShigh |
 |
|---|
General Statistics
Number of major isoforms |
Number of additional isoforms |
Number of all proteins |
Number of amino acids |
Min. Seq. Length |
Max. Seq. Length |
Avg. Seq. Length |
Avg. Mol. Weight |
|---|---|---|---|---|---|---|---|
0 |
4847628 |
8 |
6812 |
449.7 |
49.78 |
Amino acid frequency
Ala |
Cys |
Asp |
Glu |
Phe |
Gly |
His |
Ile |
Lys |
Leu |
|---|---|---|---|---|---|---|---|---|---|
8.227 ± 0.021 | 1.215 ± 0.01 |
5.5 ± 0.017 | 6.393 ± 0.026 |
3.746 ± 0.015 | 7.015 ± 0.022 |
2.272 ± 0.011 | 5.31 ± 0.019 |
5.251 ± 0.02 | 8.88 ± 0.03 |
Met |
Asn |
Gln |
Pro |
Arg |
Ser |
Thr |
Val |
Trp |
Tyr |
|---|---|---|---|---|---|---|---|---|---|
2.229 ± 0.009 | 3.911 ± 0.012 |
5.71 ± 0.025 | 3.75 ± 0.015 |
5.701 ± 0.021 | 8.381 ± 0.031 |
6.102 ± 0.016 | 6.056 ± 0.015 |
1.463 ± 0.01 | 2.89 ± 0.014 |
Most of the basic statistics you can see at this page can be downloaded from this CSV file
Proteome-pI is available under Creative Commons Attribution-NoDerivs license, for more details see here
| Reference: Kozlowski LP. Proteome-pI 2.0: Proteome Isoelectric Point Database Update. Nucleic Acids Res. 2021, doi: 10.1093/nar/gkab944 | Contact: Lukasz P. Kozlowski |
