candidate division MSBL1 archaeon SCGC-AAA261O19
Taxonomy: cellular organisms; Archaea; Euryarchaeota; Euryarchaeota incertae sedis; candidate division MSBL1
Average proteome isoelectric point is 6.33
Get precalculated fractions of proteins
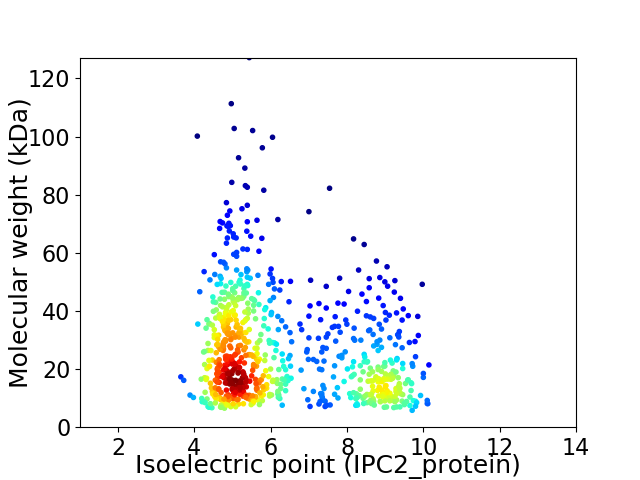
Virtual 2D-PAGE plot for 779 proteins (isoelectric point calculated using IPC2_protein)
Get csv file with sequences according to given criteria:
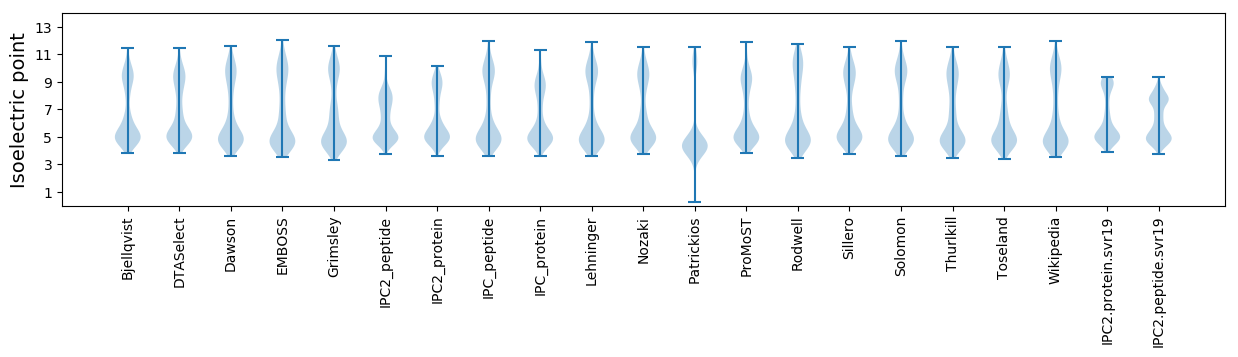
* You can choose from 21 different methods for calculating isoelectric point
Summary statistics related to proteome-wise predictions
Protein with the lowest isoelectric point:
>tr|A0A133VEJ6|A0A133VEJ6_9EURY Uncharacterized protein OS=candidate division MSBL1 archaeon SCGC-AAA261O19 OX=1698277 GN=AKJ48_01075 PE=4 SV=1
MM1 pKa = 7.71PNVIYY6 pKa = 10.26DD7 pKa = 3.61YY8 pKa = 11.37GKK10 pKa = 10.58CNGNASCAEE19 pKa = 4.0VCPVNILEE27 pKa = 4.15EE28 pKa = 4.49SEE30 pKa = 3.73NGRR33 pKa = 11.84WCKK36 pKa = 10.44PIDD39 pKa = 3.4EE40 pKa = 4.37KK41 pKa = 11.71VEE43 pKa = 3.81NEE45 pKa = 3.9EE46 pKa = 4.12AVKK49 pKa = 10.41QFHH52 pKa = 6.6EE53 pKa = 4.48EE54 pKa = 4.11VEE56 pKa = 4.24EE57 pKa = 5.14SEE59 pKa = 4.43TQLDD63 pKa = 3.79VTIEE67 pKa = 3.95NDD69 pKa = 3.31MPEE72 pKa = 5.31CIQCMACVASCPEE85 pKa = 3.87DD86 pKa = 4.59AIQIEE91 pKa = 4.38
MM1 pKa = 7.71PNVIYY6 pKa = 10.26DD7 pKa = 3.61YY8 pKa = 11.37GKK10 pKa = 10.58CNGNASCAEE19 pKa = 4.0VCPVNILEE27 pKa = 4.15EE28 pKa = 4.49SEE30 pKa = 3.73NGRR33 pKa = 11.84WCKK36 pKa = 10.44PIDD39 pKa = 3.4EE40 pKa = 4.37KK41 pKa = 11.71VEE43 pKa = 3.81NEE45 pKa = 3.9EE46 pKa = 4.12AVKK49 pKa = 10.41QFHH52 pKa = 6.6EE53 pKa = 4.48EE54 pKa = 4.11VEE56 pKa = 4.24EE57 pKa = 5.14SEE59 pKa = 4.43TQLDD63 pKa = 3.79VTIEE67 pKa = 3.95NDD69 pKa = 3.31MPEE72 pKa = 5.31CIQCMACVASCPEE85 pKa = 3.87DD86 pKa = 4.59AIQIEE91 pKa = 4.38
Molecular weight: 10.23 kDa
Isoelectric point according different methods:
Protein with the highest isoelectric point:
>tr|A0A133VD18|A0A133VD18_9EURY Ornithine carbamoyltransferase OS=candidate division MSBL1 archaeon SCGC-AAA261O19 OX=1698277 GN=AKJ48_02975 PE=3 SV=1
MM1 pKa = 7.44KK2 pKa = 10.43SVGGTPRR9 pKa = 11.84FYY11 pKa = 10.28PKK13 pKa = 10.52EE14 pKa = 4.47GITLRR19 pKa = 11.84RR20 pKa = 11.84RR21 pKa = 11.84GSWAWTEE28 pKa = 3.84MLFDD32 pKa = 5.57LMVDD36 pKa = 3.59PQRR39 pKa = 11.84WLRR42 pKa = 11.84EE43 pKa = 3.56YY44 pKa = 10.3HH45 pKa = 5.65VRR47 pKa = 11.84SNVEE51 pKa = 3.79SGFSIFTRR59 pKa = 11.84DD60 pKa = 3.18FLAPLRR66 pKa = 11.84KK67 pKa = 9.18RR68 pKa = 11.84IHH70 pKa = 6.32RR71 pKa = 11.84RR72 pKa = 11.84RR73 pKa = 11.84KK74 pKa = 7.27TEE76 pKa = 3.61AFARR80 pKa = 11.84TCDD83 pKa = 3.73YY84 pKa = 11.17NLKK87 pKa = 7.93QACYY91 pKa = 10.14ARR93 pKa = 11.84HH94 pKa = 5.27QEE96 pKa = 4.06GLIAPWMNTT105 pKa = 2.93
MM1 pKa = 7.44KK2 pKa = 10.43SVGGTPRR9 pKa = 11.84FYY11 pKa = 10.28PKK13 pKa = 10.52EE14 pKa = 4.47GITLRR19 pKa = 11.84RR20 pKa = 11.84RR21 pKa = 11.84GSWAWTEE28 pKa = 3.84MLFDD32 pKa = 5.57LMVDD36 pKa = 3.59PQRR39 pKa = 11.84WLRR42 pKa = 11.84EE43 pKa = 3.56YY44 pKa = 10.3HH45 pKa = 5.65VRR47 pKa = 11.84SNVEE51 pKa = 3.79SGFSIFTRR59 pKa = 11.84DD60 pKa = 3.18FLAPLRR66 pKa = 11.84KK67 pKa = 9.18RR68 pKa = 11.84IHH70 pKa = 6.32RR71 pKa = 11.84RR72 pKa = 11.84RR73 pKa = 11.84KK74 pKa = 7.27TEE76 pKa = 3.61AFARR80 pKa = 11.84TCDD83 pKa = 3.73YY84 pKa = 11.17NLKK87 pKa = 7.93QACYY91 pKa = 10.14ARR93 pKa = 11.84HH94 pKa = 5.27QEE96 pKa = 4.06GLIAPWMNTT105 pKa = 2.93
Molecular weight: 12.61 kDa
Isoelectric point according different methods:
Peptides (in silico digests for buttom-up proteomics)
Below you can find in silico digests of the whole proteome with Trypsin, Chymotrypsin, Trypsin+LysC, LysN, ArgC proteases suitable for different mass spec machines.| Try ESI |
 |
|---|
| ChTry ESI |
|
|---|
| ArgC ESI |
|
|---|
| LysN ESI |
|
|---|
| TryLysC ESI |
|
|---|
| Try MALDI |
|
|---|
| ChTry MALDI |
|
|---|
| ArgC MALDI |
|
|---|
| LysN MALDI |
|
|---|
| TryLysC MALDI |
|
|---|
| Try LTQ |
|
|---|
| ChTry LTQ |
|
|---|
| ArgC LTQ |
|
|---|
| LysN LTQ |
|
|---|
| TryLysC LTQ |
|
|---|
| Try MSlow |
|
|---|
| ChTry MSlow |
|
|---|
| ArgC MSlow |
|
|---|
| LysN MSlow |
|
|---|
| TryLysC MSlow |
|
|---|
| Try MShigh |
|
|---|
| ChTry MShigh |
|
|---|
| ArgC MShigh |
|
|---|
| LysN MShigh |
|
|---|
| TryLysC MShigh |
|
|---|
General Statistics
Number of major isoforms |
Number of additional isoforms |
Number of all proteins |
Number of amino acids |
Min. Seq. Length |
Max. Seq. Length |
Avg. Seq. Length |
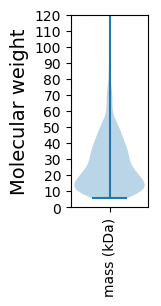
Avg. Mol. Weight |
|---|---|---|---|---|---|---|---|
0 |
190618 |
50 |
1136 |
244.7 |
27.4 |
Amino acid frequency
Ala |
Cys |
Asp |
Glu |
Phe |
Gly |
His |
Ile |
Lys |
Leu |
|---|---|---|---|---|---|---|---|---|---|
6.876 ± 0.093 | 0.965 ± 0.036 |
5.485 ± 0.081 | 9.471 ± 0.113 |
3.708 ± 0.061 | 7.659 ± 0.086 |
1.829 ± 0.038 | 7.209 ± 0.079 |
7.179 ± 0.113 | 9.752 ± 0.086 |
Met |
Asn |
Gln |
Pro |
Arg |
Ser |
Thr |
Val |
Trp |
Tyr |
|---|---|---|---|---|---|---|---|---|---|
2.216 ± 0.035 | 3.346 ± 0.06 |
4.264 ± 0.054 | 2.459 ± 0.042 |
5.716 ± 0.083 | 6.025 ± 0.08 |
4.934 ± 0.058 | 6.974 ± 0.071 |
1.114 ± 0.036 | 2.817 ± 0.053 |
Most of the basic statistics you can see at this page can be downloaded from this CSV file
See this proteome in:

Proteome-pI is available under Creative Commons Attribution-NoDerivs license, for more details see here
| Reference: Kozlowski LP. Proteome-pI 2.0: Proteome Isoelectric Point Database Update. Nucleic Acids Res. 2021, doi: 10.1093/nar/gkab944 | Contact: Lukasz P. Kozlowski |