Ruegeria litorea R37
Taxonomy: cellular organisms; Bacteria; Proteobacteria; Alphaproteobacteria; Rhodobacterales; Roseobacteraceae; Ruegeria; Ruegeria litorea
Average proteome isoelectric point is 5.93
Get precalculated fractions of proteins

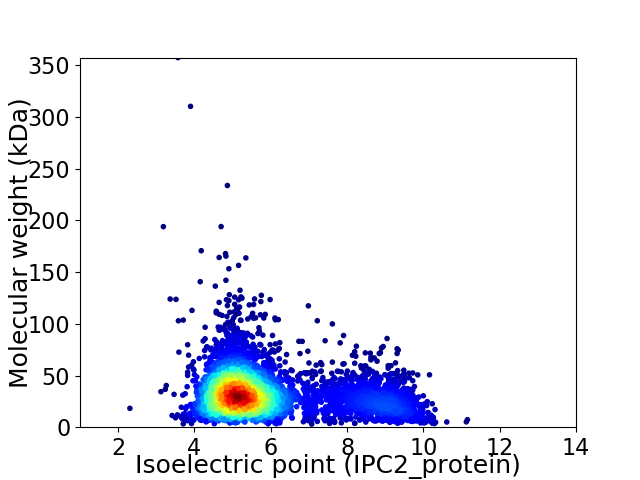
Virtual 2D-PAGE plot for 4492 proteins (isoelectric point calculated using IPC2_protein)
Get csv file with sequences according to given criteria:
* You can choose from 21 different methods for calculating isoelectric point
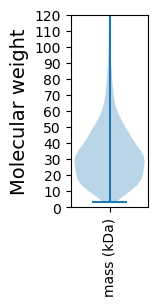
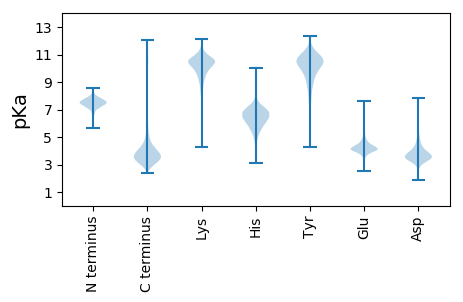
Summary statistics related to proteome-wise predictions


Protein with the lowest isoelectric point:
>tr|A0A1Y5TNW7|A0A1Y5TNW7_9RHOB UDP-2 3-diacylglucosamine hydrolase OS=Ruegeria litorea R37 OX=1200284 GN=TRL7639_03633 PE=4 SV=1
MM1 pKa = 7.4TRR3 pKa = 11.84FKK5 pKa = 11.04SYY7 pKa = 11.1VLATGLLAGLTAPATAEE24 pKa = 3.94FSFDD28 pKa = 3.76ADD30 pKa = 3.64EE31 pKa = 4.3ATQAYY36 pKa = 9.73VEE38 pKa = 4.46ANLLGIFYY46 pKa = 10.39HH47 pKa = 6.36EE48 pKa = 5.31LGHH51 pKa = 7.57ALIDD55 pKa = 3.88MLDD58 pKa = 3.73LPIFGQEE65 pKa = 3.25EE66 pKa = 3.83DD67 pKa = 3.71AADD70 pKa = 3.74VLSVFLIDD78 pKa = 4.32ALYY81 pKa = 10.27EE82 pKa = 3.98EE83 pKa = 5.36EE84 pKa = 4.44SAVDD88 pKa = 3.74LAYY91 pKa = 9.21GTAFGFLGEE100 pKa = 4.26VEE102 pKa = 3.94QRR104 pKa = 11.84EE105 pKa = 4.52AEE107 pKa = 4.23NEE109 pKa = 3.8LPAYY113 pKa = 9.01WDD115 pKa = 3.15VHH117 pKa = 7.28GPDD120 pKa = 3.16LQRR123 pKa = 11.84YY124 pKa = 7.68FNLVCIFFGANPDD137 pKa = 3.27EE138 pKa = 4.7RR139 pKa = 11.84ADD141 pKa = 3.67VADD144 pKa = 4.99DD145 pKa = 4.2LGLPADD151 pKa = 4.13RR152 pKa = 11.84AEE154 pKa = 4.22YY155 pKa = 10.87CPDD158 pKa = 3.4EE159 pKa = 4.85YY160 pKa = 11.54DD161 pKa = 4.33QADD164 pKa = 4.1HH165 pKa = 6.25SWGVALEE172 pKa = 4.74EE173 pKa = 4.72ILTDD177 pKa = 4.42HH178 pKa = 7.58PAQSIRR184 pKa = 11.84LGSSRR189 pKa = 11.84STPTEE194 pKa = 3.54ATSPPRR200 pKa = 4.32
MM1 pKa = 7.4TRR3 pKa = 11.84FKK5 pKa = 11.04SYY7 pKa = 11.1VLATGLLAGLTAPATAEE24 pKa = 3.94FSFDD28 pKa = 3.76ADD30 pKa = 3.64EE31 pKa = 4.3ATQAYY36 pKa = 9.73VEE38 pKa = 4.46ANLLGIFYY46 pKa = 10.39HH47 pKa = 6.36EE48 pKa = 5.31LGHH51 pKa = 7.57ALIDD55 pKa = 3.88MLDD58 pKa = 3.73LPIFGQEE65 pKa = 3.25EE66 pKa = 3.83DD67 pKa = 3.71AADD70 pKa = 3.74VLSVFLIDD78 pKa = 4.32ALYY81 pKa = 10.27EE82 pKa = 3.98EE83 pKa = 5.36EE84 pKa = 4.44SAVDD88 pKa = 3.74LAYY91 pKa = 9.21GTAFGFLGEE100 pKa = 4.26VEE102 pKa = 3.94QRR104 pKa = 11.84EE105 pKa = 4.52AEE107 pKa = 4.23NEE109 pKa = 3.8LPAYY113 pKa = 9.01WDD115 pKa = 3.15VHH117 pKa = 7.28GPDD120 pKa = 3.16LQRR123 pKa = 11.84YY124 pKa = 7.68FNLVCIFFGANPDD137 pKa = 3.27EE138 pKa = 4.7RR139 pKa = 11.84ADD141 pKa = 3.67VADD144 pKa = 4.99DD145 pKa = 4.2LGLPADD151 pKa = 4.13RR152 pKa = 11.84AEE154 pKa = 4.22YY155 pKa = 10.87CPDD158 pKa = 3.4EE159 pKa = 4.85YY160 pKa = 11.54DD161 pKa = 4.33QADD164 pKa = 4.1HH165 pKa = 6.25SWGVALEE172 pKa = 4.74EE173 pKa = 4.72ILTDD177 pKa = 4.42HH178 pKa = 7.58PAQSIRR184 pKa = 11.84LGSSRR189 pKa = 11.84STPTEE194 pKa = 3.54ATSPPRR200 pKa = 4.32
Molecular weight: 22.0 kDa
Isoelectric point according different methods:
Protein with the highest isoelectric point:
>tr|A0A1Y5RBG9|A0A1Y5RBG9_9RHOB Cytochrome c OS=Ruegeria litorea R37 OX=1200284 GN=TRL7639_00046 PE=4 SV=1
MM1 pKa = 7.76KK2 pKa = 9.8FRR4 pKa = 11.84PMMLINWQSRR14 pKa = 11.84FWRR17 pKa = 11.84KK18 pKa = 8.88PGQRR22 pKa = 11.84GKK24 pKa = 10.75LGAAARR30 pKa = 11.84SLLRR34 pKa = 11.84SRR36 pKa = 11.84KK37 pKa = 9.48NIAAIARR44 pKa = 11.84LIRR47 pKa = 11.84ILKK50 pKa = 9.85SSAIFLILMIPISS63 pKa = 3.62
MM1 pKa = 7.76KK2 pKa = 9.8FRR4 pKa = 11.84PMMLINWQSRR14 pKa = 11.84FWRR17 pKa = 11.84KK18 pKa = 8.88PGQRR22 pKa = 11.84GKK24 pKa = 10.75LGAAARR30 pKa = 11.84SLLRR34 pKa = 11.84SRR36 pKa = 11.84KK37 pKa = 9.48NIAAIARR44 pKa = 11.84LIRR47 pKa = 11.84ILKK50 pKa = 9.85SSAIFLILMIPISS63 pKa = 3.62
Molecular weight: 7.29 kDa
Isoelectric point according different methods:
Peptides (in silico digests for buttom-up proteomics)
Below you can find in silico digests of the whole proteome with Trypsin, Chymotrypsin, Trypsin+LysC, LysN, ArgC proteases suitable for different mass spec machines.| Try ESI |
 |
|---|
| ChTry ESI |
 |
|---|
| ArgC ESI |
 |
|---|
| LysN ESI |
 |
|---|
| TryLysC ESI |
 |
|---|
| Try MALDI |
 |
|---|
| ChTry MALDI |
 |
|---|
| ArgC MALDI |
 |
|---|
| LysN MALDI |
 |
|---|
| TryLysC MALDI |
 |
|---|
| Try LTQ |
 |
|---|
| ChTry LTQ |
 |
|---|
| ArgC LTQ |
 |
|---|
| LysN LTQ |
 |
|---|
| TryLysC LTQ |
 |
|---|
| Try MSlow |
 |
|---|
| ChTry MSlow |
 |
|---|
| ArgC MSlow |
 |
|---|
| LysN MSlow |
 |
|---|
| TryLysC MSlow |
 |
|---|
| Try MShigh |
 |
|---|
| ChTry MShigh |
 |
|---|
| ArgC MShigh |
 |
|---|
| LysN MShigh |
 |
|---|
| TryLysC MShigh |
 |
|---|
General Statistics
Number of major isoforms |
Number of additional isoforms |
Number of all proteins |
Number of amino acids |
Min. Seq. Length |
Max. Seq. Length |
Avg. Seq. Length |
Avg. Mol. Weight |
|---|---|---|---|---|---|---|---|
0 |
1412364 |
29 |
3456 |
314.4 |
34.25 |
Amino acid frequency
Ala |
Cys |
Asp |
Glu |
Phe |
Gly |
His |
Ile |
Lys |
Leu |
|---|---|---|---|---|---|---|---|---|---|
11.399 ± 0.046 | 0.926 ± 0.012 |
6.208 ± 0.034 | 5.924 ± 0.032 |
3.838 ± 0.022 | 8.575 ± 0.04 |
2.161 ± 0.018 | 5.182 ± 0.025 |
3.426 ± 0.024 | 9.833 ± 0.038 |
Met |
Asn |
Gln |
Pro |
Arg |
Ser |
Thr |
Val |
Trp |
Tyr |
|---|---|---|---|---|---|---|---|---|---|
2.864 ± 0.019 | 2.902 ± 0.023 |
4.965 ± 0.025 | 3.532 ± 0.019 |
6.147 ± 0.035 | 5.384 ± 0.027 |
5.602 ± 0.029 | 7.367 ± 0.029 |
1.423 ± 0.014 | 2.342 ± 0.016 |
Most of the basic statistics you can see at this page can be downloaded from this CSV file
Proteome-pI is available under Creative Commons Attribution-NoDerivs license, for more details see here
| Reference: Kozlowski LP. Proteome-pI 2.0: Proteome Isoelectric Point Database Update. Nucleic Acids Res. 2021, doi: 10.1093/nar/gkab944 | Contact: Lukasz P. Kozlowski |
