Olsenella scatoligenes
Taxonomy: cellular organisms; Bacteria; Terrabacteria group; Actinobacteria; Coriobacteriia; Coriobacteriales; Atopobiaceae; Tractidigestivibacter
Average proteome isoelectric point is 5.65
Get precalculated fractions of proteins

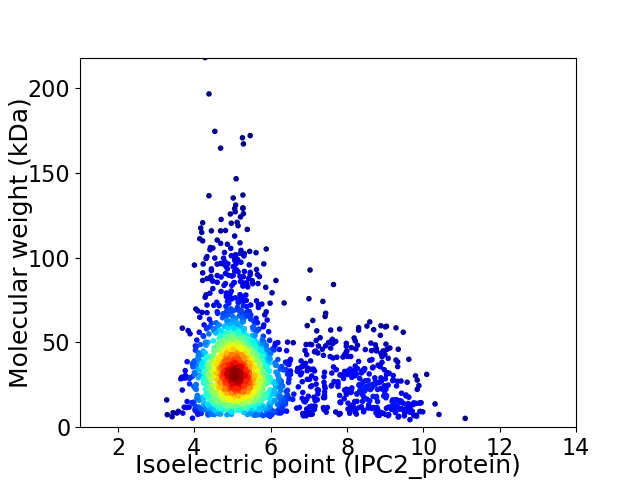
Virtual 2D-PAGE plot for 2032 proteins (isoelectric point calculated using IPC2_protein)
Get csv file with sequences according to given criteria:
* You can choose from 21 different methods for calculating isoelectric point
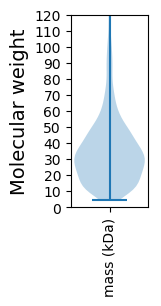
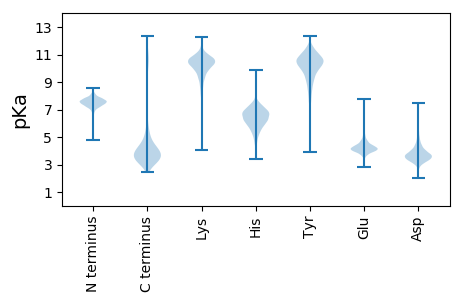
Summary statistics related to proteome-wise predictions


Protein with the lowest isoelectric point:
>tr|A0A100YW27|A0A100YW27_9ACTN Aconitate hydratase OS=Olsenella scatoligenes OX=1299998 GN=acnA PE=3 SV=1
MM1 pKa = 7.32TGALGLAACGSSTTASSSSTTSSSADD27 pKa = 3.09ASSASTTSFDD37 pKa = 3.72GNFVLGFDD45 pKa = 4.5QDD47 pKa = 4.02FPPYY51 pKa = 10.44GYY53 pKa = 10.59VGNDD57 pKa = 3.14GSYY60 pKa = 9.83TGFDD64 pKa = 3.13IDD66 pKa = 5.22LAQAVCDD73 pKa = 3.83RR74 pKa = 11.84EE75 pKa = 4.39GWTLVPTPISWDD87 pKa = 3.51AKK89 pKa = 9.86DD90 pKa = 3.41TLLNSGQITCIWNGFTIEE108 pKa = 3.95GRR110 pKa = 11.84EE111 pKa = 4.03DD112 pKa = 3.79GYY114 pKa = 11.68AFTDD118 pKa = 4.03PYY120 pKa = 10.24MEE122 pKa = 4.12NRR124 pKa = 11.84QVVVVPASSDD134 pKa = 3.56VQQLSDD140 pKa = 3.64LAGKK144 pKa = 9.69NVITQADD151 pKa = 3.94SAALDD156 pKa = 3.67VLSEE160 pKa = 4.36GGSQEE165 pKa = 3.99EE166 pKa = 4.33LGKK169 pKa = 10.85SFGNLQTIDD178 pKa = 3.62NYY180 pKa = 9.73NTAFMMLEE188 pKa = 4.14SGQVDD193 pKa = 5.29AIAIDD198 pKa = 3.77YY199 pKa = 8.6PVAVFNIGDD208 pKa = 3.64KK209 pKa = 10.19TSEE212 pKa = 4.02FRR214 pKa = 11.84ILDD217 pKa = 3.54EE218 pKa = 4.52NLNSEE223 pKa = 4.22HH224 pKa = 6.71FGVGFANTDD233 pKa = 3.75DD234 pKa = 4.17GAQLAKK240 pKa = 9.9TVEE243 pKa = 4.26ADD245 pKa = 3.73LQVLDD250 pKa = 4.16SEE252 pKa = 4.94GTVKK256 pKa = 10.27EE257 pKa = 4.12LCEE260 pKa = 4.2KK261 pKa = 10.79YY262 pKa = 10.55ADD264 pKa = 3.66QGVSYY269 pKa = 10.5DD270 pKa = 3.82LWCLPKK276 pKa = 10.66AA277 pKa = 4.01
MM1 pKa = 7.32TGALGLAACGSSTTASSSSTTSSSADD27 pKa = 3.09ASSASTTSFDD37 pKa = 3.72GNFVLGFDD45 pKa = 4.5QDD47 pKa = 4.02FPPYY51 pKa = 10.44GYY53 pKa = 10.59VGNDD57 pKa = 3.14GSYY60 pKa = 9.83TGFDD64 pKa = 3.13IDD66 pKa = 5.22LAQAVCDD73 pKa = 3.83RR74 pKa = 11.84EE75 pKa = 4.39GWTLVPTPISWDD87 pKa = 3.51AKK89 pKa = 9.86DD90 pKa = 3.41TLLNSGQITCIWNGFTIEE108 pKa = 3.95GRR110 pKa = 11.84EE111 pKa = 4.03DD112 pKa = 3.79GYY114 pKa = 11.68AFTDD118 pKa = 4.03PYY120 pKa = 10.24MEE122 pKa = 4.12NRR124 pKa = 11.84QVVVVPASSDD134 pKa = 3.56VQQLSDD140 pKa = 3.64LAGKK144 pKa = 9.69NVITQADD151 pKa = 3.94SAALDD156 pKa = 3.67VLSEE160 pKa = 4.36GGSQEE165 pKa = 3.99EE166 pKa = 4.33LGKK169 pKa = 10.85SFGNLQTIDD178 pKa = 3.62NYY180 pKa = 9.73NTAFMMLEE188 pKa = 4.14SGQVDD193 pKa = 5.29AIAIDD198 pKa = 3.77YY199 pKa = 8.6PVAVFNIGDD208 pKa = 3.64KK209 pKa = 10.19TSEE212 pKa = 4.02FRR214 pKa = 11.84ILDD217 pKa = 3.54EE218 pKa = 4.52NLNSEE223 pKa = 4.22HH224 pKa = 6.71FGVGFANTDD233 pKa = 3.75DD234 pKa = 4.17GAQLAKK240 pKa = 9.9TVEE243 pKa = 4.26ADD245 pKa = 3.73LQVLDD250 pKa = 4.16SEE252 pKa = 4.94GTVKK256 pKa = 10.27EE257 pKa = 4.12LCEE260 pKa = 4.2KK261 pKa = 10.79YY262 pKa = 10.55ADD264 pKa = 3.66QGVSYY269 pKa = 10.5DD270 pKa = 3.82LWCLPKK276 pKa = 10.66AA277 pKa = 4.01
Molecular weight: 29.45 kDa
Isoelectric point according different methods:
Protein with the highest isoelectric point:
>tr|A0A100YWD7|A0A100YWD7_9ACTN Two-component system response regulator OS=Olsenella scatoligenes OX=1299998 GN=AUL39_00770 PE=4 SV=1
MM1 pKa = 7.35KK2 pKa = 9.42RR3 pKa = 11.84TYY5 pKa = 10.34QPNKK9 pKa = 8.62RR10 pKa = 11.84KK11 pKa = 9.56RR12 pKa = 11.84AKK14 pKa = 8.76THH16 pKa = 5.23GFRR19 pKa = 11.84ARR21 pKa = 11.84MATKK25 pKa = 10.36GGRR28 pKa = 11.84KK29 pKa = 8.76VLARR33 pKa = 11.84RR34 pKa = 11.84RR35 pKa = 11.84AKK37 pKa = 10.12GRR39 pKa = 11.84KK40 pKa = 8.12QLTVV44 pKa = 2.97
MM1 pKa = 7.35KK2 pKa = 9.42RR3 pKa = 11.84TYY5 pKa = 10.34QPNKK9 pKa = 8.62RR10 pKa = 11.84KK11 pKa = 9.56RR12 pKa = 11.84AKK14 pKa = 8.76THH16 pKa = 5.23GFRR19 pKa = 11.84ARR21 pKa = 11.84MATKK25 pKa = 10.36GGRR28 pKa = 11.84KK29 pKa = 8.76VLARR33 pKa = 11.84RR34 pKa = 11.84RR35 pKa = 11.84AKK37 pKa = 10.12GRR39 pKa = 11.84KK40 pKa = 8.12QLTVV44 pKa = 2.97
Molecular weight: 5.2 kDa
Isoelectric point according different methods:
Peptides (in silico digests for buttom-up proteomics)
Below you can find in silico digests of the whole proteome with Trypsin, Chymotrypsin, Trypsin+LysC, LysN, ArgC proteases suitable for different mass spec machines.| Try ESI |
 |
|---|
| ChTry ESI |
 |
|---|
| ArgC ESI |
 |
|---|
| LysN ESI |
 |
|---|
| TryLysC ESI |
 |
|---|
| Try MALDI |
 |
|---|
| ChTry MALDI |
 |
|---|
| ArgC MALDI |
 |
|---|
| LysN MALDI |
 |
|---|
| TryLysC MALDI |
 |
|---|
| Try LTQ |
 |
|---|
| ChTry LTQ |
 |
|---|
| ArgC LTQ |
 |
|---|
| LysN LTQ |
 |
|---|
| TryLysC LTQ |
 |
|---|
| Try MSlow |
 |
|---|
| ChTry MSlow |
 |
|---|
| ArgC MSlow |
 |
|---|
| LysN MSlow |
 |
|---|
| TryLysC MSlow |
 |
|---|
| Try MShigh |
 |
|---|
| ChTry MShigh |
 |
|---|
| ArgC MShigh |
 |
|---|
| LysN MShigh |
 |
|---|
| TryLysC MShigh |
 |
|---|
General Statistics
Number of major isoforms |
Number of additional isoforms |
Number of all proteins |
Number of amino acids |
Min. Seq. Length |
Max. Seq. Length |
Avg. Seq. Length |
Avg. Mol. Weight |
|---|---|---|---|---|---|---|---|
0 |
684394 |
37 |
2041 |
336.8 |
36.59 |
Amino acid frequency
Ala |
Cys |
Asp |
Glu |
Phe |
Gly |
His |
Ile |
Lys |
Leu |
|---|---|---|---|---|---|---|---|---|---|
11.136 ± 0.077 | 1.533 ± 0.026 |
6.451 ± 0.048 | 6.439 ± 0.05 |
3.418 ± 0.031 | 8.388 ± 0.051 |
1.989 ± 0.023 | 4.724 ± 0.047 |
3.568 ± 0.048 | 9.105 ± 0.053 |
Met |
Asn |
Gln |
Pro |
Arg |
Ser |
Thr |
Val |
Trp |
Tyr |
|---|---|---|---|---|---|---|---|---|---|
2.592 ± 0.027 | 2.882 ± 0.028 |
4.343 ± 0.034 | 2.931 ± 0.026 |
6.165 ± 0.058 | 6.235 ± 0.057 |
5.688 ± 0.055 | 8.421 ± 0.048 |
1.124 ± 0.019 | 2.87 ± 0.03 |
Most of the basic statistics you can see at this page can be downloaded from this CSV file
Proteome-pI is available under Creative Commons Attribution-NoDerivs license, for more details see here
| Reference: Kozlowski LP. Proteome-pI 2.0: Proteome Isoelectric Point Database Update. Nucleic Acids Res. 2021, doi: 10.1093/nar/gkab944 | Contact: Lukasz P. Kozlowski |
