Bos mutus (wild yak)
Taxonomy: cellular organisms; Eukaryota; Opisthokonta; Metazoa; Eumetazoa; Bilateria; Deuterostomia; Chordata; Craniata; Vertebrata; Gnathostomata; Teleostomi; Euteleostomi; Sarcopterygii; Dipnotetrapodomorpha; Tetrapoda; Amniota; Mammalia; Theria; Eutheria; Boreoeutheria; Laurasiatheria;
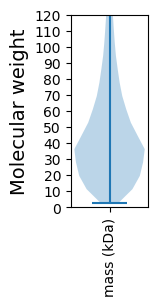
Average proteome isoelectric point is 6.83
Get precalculated fractions of proteins

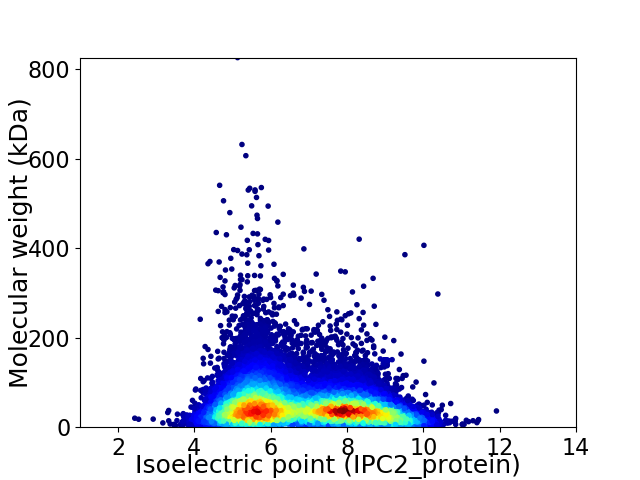
Virtual 2D-PAGE plot for 18553 proteins (isoelectric point calculated using IPC2_protein)
Get csv file with sequences according to given criteria:
* You can choose from 21 different methods for calculating isoelectric point
Summary statistics related to proteome-wise predictions


Protein with the lowest isoelectric point:
>tr|L8IK42|L8IK42_9CETA Inter-alpha-trypsin inhibitor heavy chain H4 OS=Bos mutus OX=72004 GN=M91_14526 PE=3 SV=1
PP1 pKa = 5.8QTAFAPADD9 pKa = 3.35HH10 pKa = 6.86SSQEE14 pKa = 4.14KK15 pKa = 8.84ATEE18 pKa = 3.96NATDD22 pKa = 4.09RR23 pKa = 11.84LNGAQSIPHH32 pKa = 7.22DD33 pKa = 4.34SPAHH37 pKa = 5.9GEE39 pKa = 4.19GTHH42 pKa = 6.63CEE44 pKa = 4.09EE45 pKa = 4.67EE46 pKa = 4.83GFAEE50 pKa = 5.34DD51 pKa = 6.15DD52 pKa = 3.82EE53 pKa = 7.08DD54 pKa = 5.82SDD56 pKa = 5.27GEE58 pKa = 4.03PSPWEE63 pKa = 3.86LSEE66 pKa = 4.68GMSGCLPKK74 pKa = 10.57EE75 pKa = 3.68QAGDD79 pKa = 3.86LFHH82 pKa = 7.39EE83 pKa = 4.81DD84 pKa = 2.66WDD86 pKa = 4.61LEE88 pKa = 4.33LKK90 pKa = 10.49ADD92 pKa = 3.94QGNPYY97 pKa = 10.37DD98 pKa = 4.73ADD100 pKa = 5.11DD101 pKa = 3.93IQGCLSQEE109 pKa = 3.69VRR111 pKa = 11.84PWVCCAPQGDD121 pKa = 4.66MIYY124 pKa = 10.59DD125 pKa = 4.29PSWHH129 pKa = 6.9HH130 pKa = 6.75PPPLIPHH137 pKa = 5.6YY138 pKa = 10.76SKK140 pKa = 10.49MVFEE144 pKa = 5.05TGQFDD149 pKa = 4.21DD150 pKa = 6.01AEE152 pKa = 4.35DD153 pKa = 3.31
PP1 pKa = 5.8QTAFAPADD9 pKa = 3.35HH10 pKa = 6.86SSQEE14 pKa = 4.14KK15 pKa = 8.84ATEE18 pKa = 3.96NATDD22 pKa = 4.09RR23 pKa = 11.84LNGAQSIPHH32 pKa = 7.22DD33 pKa = 4.34SPAHH37 pKa = 5.9GEE39 pKa = 4.19GTHH42 pKa = 6.63CEE44 pKa = 4.09EE45 pKa = 4.67EE46 pKa = 4.83GFAEE50 pKa = 5.34DD51 pKa = 6.15DD52 pKa = 3.82EE53 pKa = 7.08DD54 pKa = 5.82SDD56 pKa = 5.27GEE58 pKa = 4.03PSPWEE63 pKa = 3.86LSEE66 pKa = 4.68GMSGCLPKK74 pKa = 10.57EE75 pKa = 3.68QAGDD79 pKa = 3.86LFHH82 pKa = 7.39EE83 pKa = 4.81DD84 pKa = 2.66WDD86 pKa = 4.61LEE88 pKa = 4.33LKK90 pKa = 10.49ADD92 pKa = 3.94QGNPYY97 pKa = 10.37DD98 pKa = 4.73ADD100 pKa = 5.11DD101 pKa = 3.93IQGCLSQEE109 pKa = 3.69VRR111 pKa = 11.84PWVCCAPQGDD121 pKa = 4.66MIYY124 pKa = 10.59DD125 pKa = 4.29PSWHH129 pKa = 6.9HH130 pKa = 6.75PPPLIPHH137 pKa = 5.6YY138 pKa = 10.76SKK140 pKa = 10.49MVFEE144 pKa = 5.05TGQFDD149 pKa = 4.21DD150 pKa = 6.01AEE152 pKa = 4.35DD153 pKa = 3.31
Molecular weight: 16.88 kDa
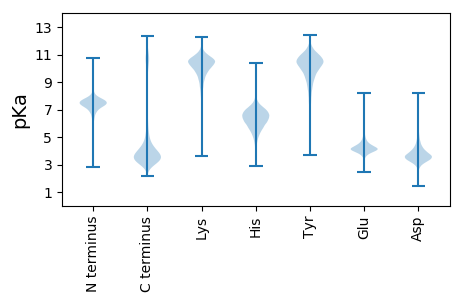
Isoelectric point according different methods:
Protein with the highest isoelectric point:
>tr|L8HSA8|L8HSA8_9CETA Olfactory receptor (Fragment) OS=Bos mutus OX=72004 GN=M91_10411 PE=3 SV=1
PP1 pKa = 7.81RR2 pKa = 11.84AQSSQVQSPQAQSSQVGSPRR22 pKa = 11.84GQSSQVPSPRR32 pKa = 11.84GQSSQIRR39 pKa = 11.84SPRR42 pKa = 11.84AQSSQVRR49 pKa = 11.84SPQAQLSQVRR59 pKa = 11.84SPRR62 pKa = 11.84AQSSQVRR69 pKa = 11.84SPRR72 pKa = 11.84AQSSQVGSPQGQSSQVWSPRR92 pKa = 11.84TQSSQVGSPQGQSSQVPSPRR112 pKa = 11.84AQSSQVGSPRR122 pKa = 11.84AQSSQVPSPWGQSSQVV138 pKa = 3.03
PP1 pKa = 7.81RR2 pKa = 11.84AQSSQVQSPQAQSSQVGSPRR22 pKa = 11.84GQSSQVPSPRR32 pKa = 11.84GQSSQIRR39 pKa = 11.84SPRR42 pKa = 11.84AQSSQVRR49 pKa = 11.84SPQAQLSQVRR59 pKa = 11.84SPRR62 pKa = 11.84AQSSQVRR69 pKa = 11.84SPRR72 pKa = 11.84AQSSQVGSPQGQSSQVWSPRR92 pKa = 11.84TQSSQVGSPQGQSSQVPSPRR112 pKa = 11.84AQSSQVGSPRR122 pKa = 11.84AQSSQVPSPWGQSSQVV138 pKa = 3.03
Molecular weight: 14.48 kDa
Isoelectric point according different methods:
Peptides (in silico digests for buttom-up proteomics)
Below you can find in silico digests of the whole proteome with Trypsin, Chymotrypsin, Trypsin+LysC, LysN, ArgC proteases suitable for different mass spec machines.| Try ESI |
 |
|---|
| ChTry ESI |
 |
|---|
| ArgC ESI |
 |
|---|
| LysN ESI |
 |
|---|
| TryLysC ESI |
 |
|---|
| Try MALDI |
 |
|---|
| ChTry MALDI |
 |
|---|
| ArgC MALDI |
 |
|---|
| LysN MALDI |
 |
|---|
| TryLysC MALDI |
 |
|---|
| Try LTQ |
 |
|---|
| ChTry LTQ |
 |
|---|
| ArgC LTQ |
 |
|---|
| LysN LTQ |
 |
|---|
| TryLysC LTQ |
 |
|---|
| Try MSlow |
 |
|---|
| ChTry MSlow |
 |
|---|
| ArgC MSlow |
 |
|---|
| LysN MSlow |
 |
|---|
| TryLysC MSlow |
 |
|---|
| Try MShigh |
 |
|---|
| ChTry MShigh |
 |
|---|
| ArgC MShigh |
 |
|---|
| LysN MShigh |
 |
|---|
| TryLysC MShigh |
 |
|---|
General Statistics
Number of major isoforms |
Number of additional isoforms |
Number of all proteins |
Number of amino acids |
Min. Seq. Length |
Max. Seq. Length |
Avg. Seq. Length |
Avg. Mol. Weight |
|---|---|---|---|---|---|---|---|
8861750 |
30 |
7294 |
477.6 |
53.32 |
Amino acid frequency
Ala |
Cys |
Asp |
Glu |
Phe |
Gly |
His |
Ile |
Lys |
Leu |
|---|---|---|---|---|---|---|---|---|---|
6.85 ± 0.019 | 2.293 ± 0.016 |
4.723 ± 0.012 | 6.901 ± 0.026 |
3.858 ± 0.013 | 6.405 ± 0.026 |
2.607 ± 0.011 | 4.567 ± 0.018 |
5.759 ± 0.024 | 10.192 ± 0.025 |
Met |
Asn |
Gln |
Pro |
Arg |
Ser |
Thr |
Val |
Trp |
Tyr |
|---|---|---|---|---|---|---|---|---|---|
2.146 ± 0.009 | 3.588 ± 0.014 |
6.112 ± 0.024 | 4.637 ± 0.016 |
5.585 ± 0.016 | 8.259 ± 0.024 |
5.339 ± 0.014 | 6.177 ± 0.015 |
1.235 ± 0.008 | 2.763 ± 0.011 |
Most of the basic statistics you can see at this page can be downloaded from this CSV file
Proteome-pI is available under Creative Commons Attribution-NoDerivs license, for more details see here
| Reference: Kozlowski LP. Proteome-pI 2.0: Proteome Isoelectric Point Database Update. Nucleic Acids Res. 2021, doi: 10.1093/nar/gkab944 | Contact: Lukasz P. Kozlowski |
