Boseongicola sp. HY14
Taxonomy: cellular organisms; Bacteria; Proteobacteria; Alphaproteobacteria; Rhodobacterales; Roseobacteraceae; Muriiphilus
Average proteome isoelectric point is 6.12
Get precalculated fractions of proteins
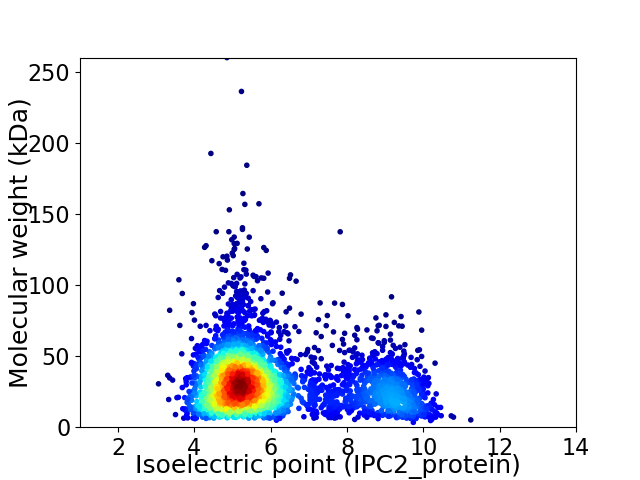
Virtual 2D-PAGE plot for 3383 proteins (isoelectric point calculated using IPC2_protein)
Get csv file with sequences according to given criteria:
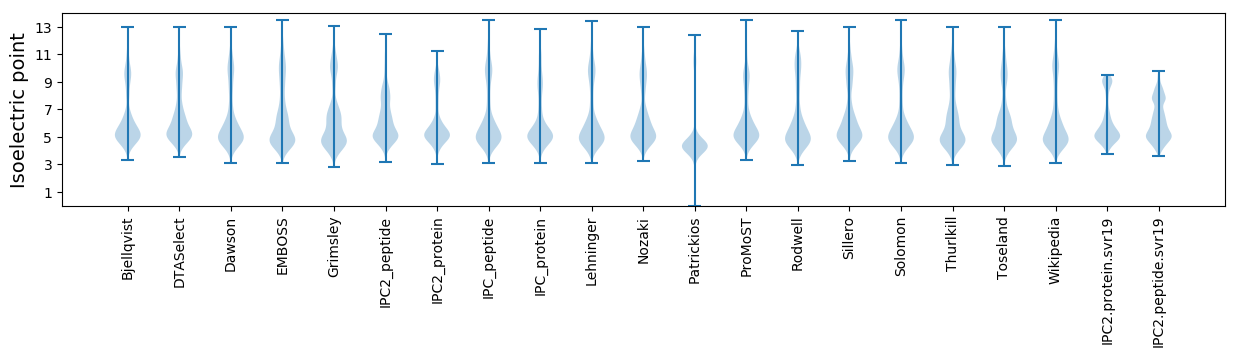
* You can choose from 21 different methods for calculating isoelectric point
Summary statistics related to proteome-wise predictions
Protein with the lowest isoelectric point:
>tr|A0A5D0R9Y2|A0A5D0R9Y2_9RHOB Proline iminopeptidase OS=Boseongicola sp. HY14 OX=2603819 GN=pip PE=3 SV=1
MM1 pKa = 7.49KK2 pKa = 10.3KK3 pKa = 9.69ILLASTILVGTAGFAAADD21 pKa = 3.84NNNFTWSGEE30 pKa = 3.94AYY32 pKa = 10.35AGVAWSTTSGFAPEE46 pKa = 4.0VTASFTAGMATTTDD60 pKa = 3.36GGLEE64 pKa = 3.86AGAKK68 pKa = 9.63IKK70 pKa = 10.27IKK72 pKa = 10.97AMGVSMNKK80 pKa = 9.75DD81 pKa = 3.02HH82 pKa = 7.33TDD84 pKa = 3.17GGFGTVTANGTTVPPEE100 pKa = 3.97GTISDD105 pKa = 3.56ASVYY109 pKa = 10.77LSGDD113 pKa = 3.2FGKK116 pKa = 11.03FEE118 pKa = 4.24VVYY121 pKa = 10.69DD122 pKa = 3.99ADD124 pKa = 3.96GASATTYY131 pKa = 10.76DD132 pKa = 3.99VNFKK136 pKa = 10.88YY137 pKa = 11.06SNTWGDD143 pKa = 3.57FTVAAYY149 pKa = 7.5YY150 pKa = 10.14TYY152 pKa = 10.81DD153 pKa = 3.4PSGTMTNGDD162 pKa = 3.75MGVKK166 pKa = 10.28LSYY169 pKa = 11.66SMADD173 pKa = 2.97YY174 pKa = 9.92TFYY177 pKa = 11.34VEE179 pKa = 4.72PEE181 pKa = 3.5WDD183 pKa = 3.72ASVTDD188 pKa = 3.64YY189 pKa = 11.3KK190 pKa = 10.89IGFGASATMSGFTGAVDD207 pKa = 4.69LDD209 pKa = 4.21YY210 pKa = 11.77EE211 pKa = 4.32NATTDD216 pKa = 3.6WDD218 pKa = 3.4WKK220 pKa = 10.94ASVKK224 pKa = 10.52YY225 pKa = 9.15ATGPYY230 pKa = 9.6SVGAFVEE237 pKa = 4.27DD238 pKa = 5.34DD239 pKa = 4.02GVDD242 pKa = 3.4DD243 pKa = 4.99QMDD246 pKa = 3.5YY247 pKa = 10.95GANVGYY253 pKa = 10.42DD254 pKa = 3.24LGGGVSLDD262 pKa = 5.12AEE264 pKa = 4.76YY265 pKa = 10.67KK266 pKa = 9.71WDD268 pKa = 3.88ADD270 pKa = 3.86TTGSIFAVGVSMKK283 pKa = 10.37FF284 pKa = 3.11
MM1 pKa = 7.49KK2 pKa = 10.3KK3 pKa = 9.69ILLASTILVGTAGFAAADD21 pKa = 3.84NNNFTWSGEE30 pKa = 3.94AYY32 pKa = 10.35AGVAWSTTSGFAPEE46 pKa = 4.0VTASFTAGMATTTDD60 pKa = 3.36GGLEE64 pKa = 3.86AGAKK68 pKa = 9.63IKK70 pKa = 10.27IKK72 pKa = 10.97AMGVSMNKK80 pKa = 9.75DD81 pKa = 3.02HH82 pKa = 7.33TDD84 pKa = 3.17GGFGTVTANGTTVPPEE100 pKa = 3.97GTISDD105 pKa = 3.56ASVYY109 pKa = 10.77LSGDD113 pKa = 3.2FGKK116 pKa = 11.03FEE118 pKa = 4.24VVYY121 pKa = 10.69DD122 pKa = 3.99ADD124 pKa = 3.96GASATTYY131 pKa = 10.76DD132 pKa = 3.99VNFKK136 pKa = 10.88YY137 pKa = 11.06SNTWGDD143 pKa = 3.57FTVAAYY149 pKa = 7.5YY150 pKa = 10.14TYY152 pKa = 10.81DD153 pKa = 3.4PSGTMTNGDD162 pKa = 3.75MGVKK166 pKa = 10.28LSYY169 pKa = 11.66SMADD173 pKa = 2.97YY174 pKa = 9.92TFYY177 pKa = 11.34VEE179 pKa = 4.72PEE181 pKa = 3.5WDD183 pKa = 3.72ASVTDD188 pKa = 3.64YY189 pKa = 11.3KK190 pKa = 10.89IGFGASATMSGFTGAVDD207 pKa = 4.69LDD209 pKa = 4.21YY210 pKa = 11.77EE211 pKa = 4.32NATTDD216 pKa = 3.6WDD218 pKa = 3.4WKK220 pKa = 10.94ASVKK224 pKa = 10.52YY225 pKa = 9.15ATGPYY230 pKa = 9.6SVGAFVEE237 pKa = 4.27DD238 pKa = 5.34DD239 pKa = 4.02GVDD242 pKa = 3.4DD243 pKa = 4.99QMDD246 pKa = 3.5YY247 pKa = 10.95GANVGYY253 pKa = 10.42DD254 pKa = 3.24LGGGVSLDD262 pKa = 5.12AEE264 pKa = 4.76YY265 pKa = 10.67KK266 pKa = 9.71WDD268 pKa = 3.88ADD270 pKa = 3.86TTGSIFAVGVSMKK283 pKa = 10.37FF284 pKa = 3.11
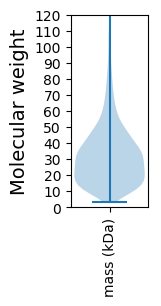
Molecular weight: 29.86 kDa
Isoelectric point according different methods:
Protein with the highest isoelectric point:
>tr|A0A5D0RH27|A0A5D0RH27_9RHOB SDR family oxidoreductase OS=Boseongicola sp. HY14 OX=2603819 GN=FVF75_10680 PE=3 SV=1
MM1 pKa = 7.45KK2 pKa = 9.61RR3 pKa = 11.84TFQPSNLVRR12 pKa = 11.84KK13 pKa = 9.18RR14 pKa = 11.84RR15 pKa = 11.84HH16 pKa = 4.42GFRR19 pKa = 11.84ARR21 pKa = 11.84MATKK25 pKa = 10.37AGRR28 pKa = 11.84KK29 pKa = 8.54ILNARR34 pKa = 11.84RR35 pKa = 11.84ARR37 pKa = 11.84GRR39 pKa = 11.84KK40 pKa = 9.07SLSAA44 pKa = 3.93
MM1 pKa = 7.45KK2 pKa = 9.61RR3 pKa = 11.84TFQPSNLVRR12 pKa = 11.84KK13 pKa = 9.18RR14 pKa = 11.84RR15 pKa = 11.84HH16 pKa = 4.42GFRR19 pKa = 11.84ARR21 pKa = 11.84MATKK25 pKa = 10.37AGRR28 pKa = 11.84KK29 pKa = 8.54ILNARR34 pKa = 11.84RR35 pKa = 11.84ARR37 pKa = 11.84GRR39 pKa = 11.84KK40 pKa = 9.07SLSAA44 pKa = 3.93
Molecular weight: 5.14 kDa
Isoelectric point according different methods:
Peptides (in silico digests for buttom-up proteomics)
Below you can find in silico digests of the whole proteome with Trypsin, Chymotrypsin, Trypsin+LysC, LysN, ArgC proteases suitable for different mass spec machines.| Try ESI |
 |
|---|
| ChTry ESI |
|
|---|
| ArgC ESI |
|
|---|
| LysN ESI |
|
|---|
| TryLysC ESI |
|
|---|
| Try MALDI |
|
|---|
| ChTry MALDI |
|
|---|
| ArgC MALDI |
|
|---|
| LysN MALDI |
|
|---|
| TryLysC MALDI |
|
|---|
| Try LTQ |
|
|---|
| ChTry LTQ |
|
|---|
| ArgC LTQ |
|
|---|
| LysN LTQ |
|
|---|
| TryLysC LTQ |
|
|---|
| Try MSlow |
|
|---|
| ChTry MSlow |
|
|---|
| ArgC MSlow |
|
|---|
| LysN MSlow |
|
|---|
| TryLysC MSlow |
|
|---|
| Try MShigh |
|
|---|
| ChTry MShigh |
|
|---|
| ArgC MShigh |
|
|---|
| LysN MShigh |
|
|---|
| TryLysC MShigh |
|
|---|
General Statistics
Number of major isoforms |
Number of additional isoforms |
Number of all proteins |
Number of amino acids |
Min. Seq. Length |
Max. Seq. Length |
Avg. Seq. Length |
Avg. Mol. Weight |
|---|---|---|---|---|---|---|---|
0 |
1054027 |
28 |
2478 |
311.6 |
33.71 |
Amino acid frequency
Ala |
Cys |
Asp |
Glu |
Phe |
Gly |
His |
Ile |
Lys |
Leu |
|---|---|---|---|---|---|---|---|---|---|
13.061 ± 0.06 | 0.787 ± 0.011 |
6.281 ± 0.036 | 5.955 ± 0.04 |
3.689 ± 0.029 | 8.992 ± 0.043 |
2.066 ± 0.019 | 5.042 ± 0.028 |
2.884 ± 0.034 | 9.899 ± 0.043 |
Met |
Asn |
Gln |
Pro |
Arg |
Ser |
Thr |
Val |
Trp |
Tyr |
|---|---|---|---|---|---|---|---|---|---|
2.766 ± 0.019 | 2.323 ± 0.021 |
5.291 ± 0.031 | 2.73 ± 0.019 |
7.182 ± 0.041 | 4.653 ± 0.025 |
5.369 ± 0.023 | 7.508 ± 0.035 |
1.392 ± 0.019 | 2.13 ± 0.02 |
Most of the basic statistics you can see at this page can be downloaded from this CSV file
See this proteome in:

Proteome-pI is available under Creative Commons Attribution-NoDerivs license, for more details see here
| Reference: Kozlowski LP. Proteome-pI 2.0: Proteome Isoelectric Point Database Update. Nucleic Acids Res. 2021, doi: 10.1093/nar/gkab944 | Contact: Lukasz P. Kozlowski |