Francolinus leucoscepus papillomavirus 1
Taxonomy: Viruses; Monodnaviria; Shotokuvirae; Cossaviricota; Papovaviricetes; Zurhausenvirales; Papillomaviridae; Firstpapillomavirinae; Dyoepsilonpapillomavirus; Dyoepsilonpapillomavirus 1
Average proteome isoelectric point is 7.0
Get precalculated fractions of proteins

Virtual 2D-PAGE plot for 8 proteins (isoelectric point calculated using IPC2_protein)
Get csv file with sequences according to given criteria:
* You can choose from 21 different methods for calculating isoelectric point
Summary statistics related to proteome-wise predictions


Protein with the lowest isoelectric point:
>tr|C6ZDA0|C6ZDA0_9PAPI E1 OS=Francolinus leucoscepus papillomavirus 1 OX=485362 GN=E1 PE=4 SV=1
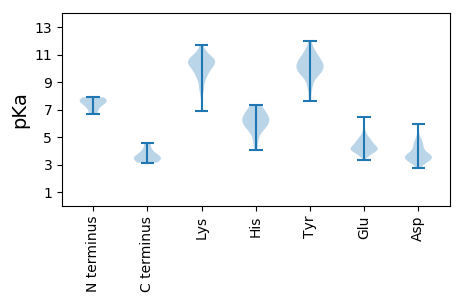
MM1 pKa = 7.89WLPDD5 pKa = 3.57IEE7 pKa = 4.74VVIALDD13 pKa = 3.77SDD15 pKa = 3.6ISSDD19 pKa = 5.09SDD21 pKa = 4.53DD22 pKa = 5.12DD23 pKa = 4.94DD24 pKa = 5.93SNSTTSTDD32 pKa = 3.31LDD34 pKa = 3.83DD35 pKa = 4.34AFGYY39 pKa = 10.62GWTFDD44 pKa = 4.1CEE46 pKa = 4.02TGRR49 pKa = 11.84ILICSEE55 pKa = 3.65QMQPSEE61 pKa = 5.24DD62 pKa = 3.82EE63 pKa = 4.89DD64 pKa = 4.28GSEE67 pKa = 4.1ASTVPAEE74 pKa = 4.33DD75 pKa = 4.48ALLHH79 pKa = 6.76DD80 pKa = 4.59IAVSGWTCAYY90 pKa = 9.47CASTLTAGEE99 pKa = 4.11IDD101 pKa = 3.45LHH103 pKa = 6.09GALDD107 pKa = 3.76EE108 pKa = 4.52EE109 pKa = 4.92EE110 pKa = 5.39CKK112 pKa = 10.86GLCNTCYY119 pKa = 9.89VGGRR123 pKa = 11.84LEE125 pKa = 4.32HH126 pKa = 6.9LFDD129 pKa = 5.16IDD131 pKa = 3.17II132 pKa = 4.58
MM1 pKa = 7.89WLPDD5 pKa = 3.57IEE7 pKa = 4.74VVIALDD13 pKa = 3.77SDD15 pKa = 3.6ISSDD19 pKa = 5.09SDD21 pKa = 4.53DD22 pKa = 5.12DD23 pKa = 4.94DD24 pKa = 5.93SNSTTSTDD32 pKa = 3.31LDD34 pKa = 3.83DD35 pKa = 4.34AFGYY39 pKa = 10.62GWTFDD44 pKa = 4.1CEE46 pKa = 4.02TGRR49 pKa = 11.84ILICSEE55 pKa = 3.65QMQPSEE61 pKa = 5.24DD62 pKa = 3.82EE63 pKa = 4.89DD64 pKa = 4.28GSEE67 pKa = 4.1ASTVPAEE74 pKa = 4.33DD75 pKa = 4.48ALLHH79 pKa = 6.76DD80 pKa = 4.59IAVSGWTCAYY90 pKa = 9.47CASTLTAGEE99 pKa = 4.11IDD101 pKa = 3.45LHH103 pKa = 6.09GALDD107 pKa = 3.76EE108 pKa = 4.52EE109 pKa = 4.92EE110 pKa = 5.39CKK112 pKa = 10.86GLCNTCYY119 pKa = 9.89VGGRR123 pKa = 11.84LEE125 pKa = 4.32HH126 pKa = 6.9LFDD129 pKa = 5.16IDD131 pKa = 3.17II132 pKa = 4.58
Molecular weight: 14.27 kDa
Isoelectric point according different methods:
Protein with the highest isoelectric point:
>tr|C6ZDA4|C6ZDA4_9PAPI L2 OS=Francolinus leucoscepus papillomavirus 1 OX=485362 GN=L2 PE=4 SV=1
MM1 pKa = 6.67TTLPSSGSRR10 pKa = 11.84GPVGRR15 pKa = 11.84MRR17 pKa = 11.84RR18 pKa = 11.84GCGIGKK24 pKa = 9.69KK25 pKa = 8.51VTDD28 pKa = 3.51THH30 pKa = 4.87TTILSGRR37 pKa = 11.84TRR39 pKa = 11.84QIGIVGAVRR48 pKa = 11.84RR49 pKa = 11.84LGGFWQGGGDD59 pKa = 3.5SVLPQLQDD67 pKa = 3.06TLTRR71 pKa = 11.84PPHH74 pKa = 4.18QTRR77 pKa = 11.84PRR79 pKa = 11.84RR80 pKa = 11.84PSDD83 pKa = 3.05PALRR87 pKa = 11.84HH88 pKa = 5.83PLPEE92 pKa = 3.89AVRR95 pKa = 11.84HH96 pKa = 4.54VRR98 pKa = 11.84GLGLRR103 pKa = 11.84VVSEE107 pKa = 3.98AFGRR111 pKa = 11.84PTSVDD116 pKa = 2.76ARR118 pKa = 11.84QPSVDD123 pKa = 3.74GVVHH127 pKa = 6.46GCSSS131 pKa = 3.13
MM1 pKa = 6.67TTLPSSGSRR10 pKa = 11.84GPVGRR15 pKa = 11.84MRR17 pKa = 11.84RR18 pKa = 11.84GCGIGKK24 pKa = 9.69KK25 pKa = 8.51VTDD28 pKa = 3.51THH30 pKa = 4.87TTILSGRR37 pKa = 11.84TRR39 pKa = 11.84QIGIVGAVRR48 pKa = 11.84RR49 pKa = 11.84LGGFWQGGGDD59 pKa = 3.5SVLPQLQDD67 pKa = 3.06TLTRR71 pKa = 11.84PPHH74 pKa = 4.18QTRR77 pKa = 11.84PRR79 pKa = 11.84RR80 pKa = 11.84PSDD83 pKa = 3.05PALRR87 pKa = 11.84HH88 pKa = 5.83PLPEE92 pKa = 3.89AVRR95 pKa = 11.84HH96 pKa = 4.54VRR98 pKa = 11.84GLGLRR103 pKa = 11.84VVSEE107 pKa = 3.98AFGRR111 pKa = 11.84PTSVDD116 pKa = 2.76ARR118 pKa = 11.84QPSVDD123 pKa = 3.74GVVHH127 pKa = 6.46GCSSS131 pKa = 3.13
Molecular weight: 13.99 kDa
Isoelectric point according different methods:
Peptides (in silico digests for buttom-up proteomics)
Below you can find in silico digests of the whole proteome with Trypsin, Chymotrypsin, Trypsin+LysC, LysN, ArgC proteases suitable for different mass spec machines.| Try ESI |
 |
|---|
| ChTry ESI |
 |
|---|
| ArgC ESI |
 |
|---|
| LysN ESI |
 |
|---|
| TryLysC ESI |
 |
|---|
| Try MALDI |
 |
|---|
| ChTry MALDI |
 |
|---|
| ArgC MALDI |
 |
|---|
| LysN MALDI |
 |
|---|
| TryLysC MALDI |
 |
|---|
| Try LTQ |
 |
|---|
| ChTry LTQ |
 |
|---|
| ArgC LTQ |
 |
|---|
| LysN LTQ |
 |
|---|
| TryLysC LTQ |
 |
|---|
| Try MSlow |
 |
|---|
| ChTry MSlow |
 |
|---|
| ArgC MSlow |
 |
|---|
| LysN MSlow |
 |
|---|
| TryLysC MSlow |
 |
|---|
| Try MShigh |
 |
|---|
| ChTry MShigh |
 |
|---|
| ArgC MShigh |
 |
|---|
| LysN MShigh |
 |
|---|
| TryLysC MShigh |
 |
|---|
General Statistics
Number of major isoforms |
Number of additional isoforms |
Number of all proteins |
Number of amino acids |
Min. Seq. Length |
Max. Seq. Length |
Avg. Seq. Length |
Avg. Mol. Weight |
|---|---|---|---|---|---|---|---|
0 |
2594 |
82 |
658 |
324.3 |
35.96 |
Amino acid frequency
Ala |
Cys |
Asp |
Glu |
Phe |
Gly |
His |
Ile |
Lys |
Leu |
|---|---|---|---|---|---|---|---|---|---|
6.669 ± 0.502 | 2.043 ± 0.454 |
6.515 ± 0.6 | 5.089 ± 0.477 |
3.547 ± 0.493 | 8.173 ± 0.719 |
2.197 ± 0.207 | 3.894 ± 0.315 |
3.045 ± 0.762 | 8.635 ± 0.589 |
Met |
Asn |
Gln |
Pro |
Arg |
Ser |
Thr |
Val |
Trp |
Tyr |
|---|---|---|---|---|---|---|---|---|---|
1.581 ± 0.301 | 2.814 ± 0.523 |
8.096 ± 1.075 | 4.009 ± 0.394 |
8.019 ± 0.842 | 7.016 ± 0.324 |
7.093 ± 0.73 | 6.823 ± 0.457 |
1.542 ± 0.19 | 3.2 ± 0.522 |
Most of the basic statistics you can see at this page can be downloaded from this CSV file
Proteome-pI is available under Creative Commons Attribution-NoDerivs license, for more details see here
| Reference: Kozlowski LP. Proteome-pI 2.0: Proteome Isoelectric Point Database Update. Nucleic Acids Res. 2021, doi: 10.1093/nar/gkab944 | Contact: Lukasz P. Kozlowski |
