Halorhabdus sp. CBA1104
Taxonomy: cellular organisms; Archaea; Euryarchaeota; Stenosarchaea group; Halobacteria; Halobacteriales; Haloarculaceae; Halorhabdus; unclassified Halorhabdus
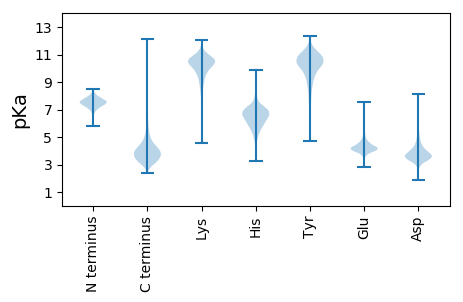
Average proteome isoelectric point is 4.83
Get precalculated fractions of proteins

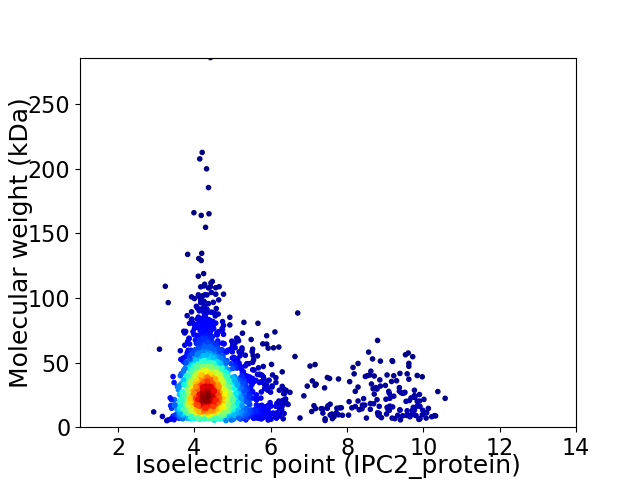
Virtual 2D-PAGE plot for 2453 proteins (isoelectric point calculated using IPC2_protein)
Get csv file with sequences according to given criteria:
* You can choose from 21 different methods for calculating isoelectric point
Summary statistics related to proteome-wise predictions


Protein with the lowest isoelectric point:
>tr|A0A650A552|A0A650A552_9EURY 30S ribosomal protein S15 OS=Halorhabdus sp. CBA1104 OX=1380432 GN=rps15 PE=3 SV=1
MM1 pKa = 7.86DD2 pKa = 5.89RR3 pKa = 11.84NPGLWLAVSIIVGIFLAVQLGALALVEE30 pKa = 4.08PLKK33 pKa = 11.06GAGLQPVEE41 pKa = 5.21DD42 pKa = 4.5PQDD45 pKa = 3.65PTNSLLYY52 pKa = 10.06ILAILVMTGVMLAAFRR68 pKa = 11.84YY69 pKa = 8.13NGEE72 pKa = 3.57WAIRR76 pKa = 11.84GLIVLTGVYY85 pKa = 10.01ISWLVFSILVPPVVTLPVAGGVHH108 pKa = 5.6VLAGAGAIAIGGGLLVYY125 pKa = 9.25PEE127 pKa = 3.78WWVIDD132 pKa = 3.21IAGAVMGAGAAGLFGITFGVLPALVLLTVLAVYY165 pKa = 9.96DD166 pKa = 4.71AISVYY171 pKa = 9.27GTEE174 pKa = 4.41HH175 pKa = 6.88MLTLAEE181 pKa = 4.64GVMDD185 pKa = 4.65LNVPVVLVAPTTLGYY200 pKa = 10.92SFIDD204 pKa = 4.18DD205 pKa = 5.0DD206 pKa = 5.01GPMDD210 pKa = 3.71GTEE213 pKa = 4.02SAEE216 pKa = 4.34TEE218 pKa = 4.13TAQQNSEE225 pKa = 4.75DD226 pKa = 4.14GDD228 pKa = 3.88TDD230 pKa = 4.61AEE232 pKa = 4.33DD233 pKa = 4.35ASFDD237 pKa = 4.23DD238 pKa = 4.99RR239 pKa = 11.84DD240 pKa = 3.57ALFIGLGDD248 pKa = 3.66AVVPTVLVASAAFFAPASVPTVGIGGFTTVLPAATAMVGTFLGLAVLLWMVLKK301 pKa = 10.74GRR303 pKa = 11.84AHH305 pKa = 7.15AGLPLLNGGVIGGYY319 pKa = 10.43LLGALASGLTLLEE332 pKa = 4.28ALGLAPYY339 pKa = 10.21LL340 pKa = 4.06
MM1 pKa = 7.86DD2 pKa = 5.89RR3 pKa = 11.84NPGLWLAVSIIVGIFLAVQLGALALVEE30 pKa = 4.08PLKK33 pKa = 11.06GAGLQPVEE41 pKa = 5.21DD42 pKa = 4.5PQDD45 pKa = 3.65PTNSLLYY52 pKa = 10.06ILAILVMTGVMLAAFRR68 pKa = 11.84YY69 pKa = 8.13NGEE72 pKa = 3.57WAIRR76 pKa = 11.84GLIVLTGVYY85 pKa = 10.01ISWLVFSILVPPVVTLPVAGGVHH108 pKa = 5.6VLAGAGAIAIGGGLLVYY125 pKa = 9.25PEE127 pKa = 3.78WWVIDD132 pKa = 3.21IAGAVMGAGAAGLFGITFGVLPALVLLTVLAVYY165 pKa = 9.96DD166 pKa = 4.71AISVYY171 pKa = 9.27GTEE174 pKa = 4.41HH175 pKa = 6.88MLTLAEE181 pKa = 4.64GVMDD185 pKa = 4.65LNVPVVLVAPTTLGYY200 pKa = 10.92SFIDD204 pKa = 4.18DD205 pKa = 5.0DD206 pKa = 5.01GPMDD210 pKa = 3.71GTEE213 pKa = 4.02SAEE216 pKa = 4.34TEE218 pKa = 4.13TAQQNSEE225 pKa = 4.75DD226 pKa = 4.14GDD228 pKa = 3.88TDD230 pKa = 4.61AEE232 pKa = 4.33DD233 pKa = 4.35ASFDD237 pKa = 4.23DD238 pKa = 4.99RR239 pKa = 11.84DD240 pKa = 3.57ALFIGLGDD248 pKa = 3.66AVVPTVLVASAAFFAPASVPTVGIGGFTTVLPAATAMVGTFLGLAVLLWMVLKK301 pKa = 10.74GRR303 pKa = 11.84AHH305 pKa = 7.15AGLPLLNGGVIGGYY319 pKa = 10.43LLGALASGLTLLEE332 pKa = 4.28ALGLAPYY339 pKa = 10.21LL340 pKa = 4.06
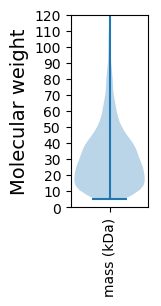
Molecular weight: 34.78 kDa
Isoelectric point according different methods:
Protein with the highest isoelectric point:
>tr|A0A650A2S1|A0A650A2S1_9EURY FAD-dependent oxidoreductase OS=Halorhabdus sp. CBA1104 OX=1380432 GN=Hrd1104_04460 PE=4 SV=1
MM1 pKa = 7.43TLRR4 pKa = 11.84LEE6 pKa = 4.4GRR8 pKa = 11.84SVSGDD13 pKa = 3.28QFRR16 pKa = 11.84AASVRR21 pKa = 11.84AGSRR25 pKa = 11.84ANAFHH30 pKa = 6.64SFEE33 pKa = 4.42RR34 pKa = 11.84YY35 pKa = 9.2SVEE38 pKa = 4.21TFSSSCLARR47 pKa = 11.84VATKK51 pKa = 10.38LRR53 pKa = 11.84AGNLGSAQMLWKK65 pKa = 10.63YY66 pKa = 10.87NYY68 pKa = 7.05QTRR71 pKa = 11.84LRR73 pKa = 11.84TTTLTYY79 pKa = 10.73HH80 pKa = 7.01LADD83 pKa = 3.7SQSTFLIRR91 pKa = 11.84VIFLGAQKK99 pKa = 9.49TLLHH103 pKa = 6.93PDD105 pKa = 3.85CPVVSPSGGNMFKK118 pKa = 10.86VVGG121 pKa = 3.8
MM1 pKa = 7.43TLRR4 pKa = 11.84LEE6 pKa = 4.4GRR8 pKa = 11.84SVSGDD13 pKa = 3.28QFRR16 pKa = 11.84AASVRR21 pKa = 11.84AGSRR25 pKa = 11.84ANAFHH30 pKa = 6.64SFEE33 pKa = 4.42RR34 pKa = 11.84YY35 pKa = 9.2SVEE38 pKa = 4.21TFSSSCLARR47 pKa = 11.84VATKK51 pKa = 10.38LRR53 pKa = 11.84AGNLGSAQMLWKK65 pKa = 10.63YY66 pKa = 10.87NYY68 pKa = 7.05QTRR71 pKa = 11.84LRR73 pKa = 11.84TTTLTYY79 pKa = 10.73HH80 pKa = 7.01LADD83 pKa = 3.7SQSTFLIRR91 pKa = 11.84VIFLGAQKK99 pKa = 9.49TLLHH103 pKa = 6.93PDD105 pKa = 3.85CPVVSPSGGNMFKK118 pKa = 10.86VVGG121 pKa = 3.8
Molecular weight: 13.37 kDa
Isoelectric point according different methods:
Peptides (in silico digests for buttom-up proteomics)
Below you can find in silico digests of the whole proteome with Trypsin, Chymotrypsin, Trypsin+LysC, LysN, ArgC proteases suitable for different mass spec machines.| Try ESI |
 |
|---|
| ChTry ESI |
 |
|---|
| ArgC ESI |
 |
|---|
| LysN ESI |
 |
|---|
| TryLysC ESI |
 |
|---|
| Try MALDI |
 |
|---|
| ChTry MALDI |
 |
|---|
| ArgC MALDI |
 |
|---|
| LysN MALDI |
 |
|---|
| TryLysC MALDI |
 |
|---|
| Try LTQ |
 |
|---|
| ChTry LTQ |
 |
|---|
| ArgC LTQ |
 |
|---|
| LysN LTQ |
 |
|---|
| TryLysC LTQ |
 |
|---|
| Try MSlow |
 |
|---|
| ChTry MSlow |
 |
|---|
| ArgC MSlow |
 |
|---|
| LysN MSlow |
 |
|---|
| TryLysC MSlow |
 |
|---|
| Try MShigh |
 |
|---|
| ChTry MShigh |
 |
|---|
| ArgC MShigh |
 |
|---|
| LysN MShigh |
 |
|---|
| TryLysC MShigh |
 |
|---|
General Statistics
Number of major isoforms |
Number of additional isoforms |
Number of all proteins |
Number of amino acids |
Min. Seq. Length |
Max. Seq. Length |
Avg. Seq. Length |
Avg. Mol. Weight |
|---|---|---|---|---|---|---|---|
0 |
727833 |
44 |
2571 |
296.7 |
32.25 |
Amino acid frequency
Ala |
Cys |
Asp |
Glu |
Phe |
Gly |
His |
Ile |
Lys |
Leu |
|---|---|---|---|---|---|---|---|---|---|
10.897 ± 0.075 | 0.658 ± 0.014 |
8.299 ± 0.066 | 8.554 ± 0.073 |
3.259 ± 0.034 | 8.35 ± 0.057 |
1.976 ± 0.022 | 4.523 ± 0.032 |
1.794 ± 0.025 | 8.94 ± 0.061 |
Met |
Asn |
Gln |
Pro |
Arg |
Ser |
Thr |
Val |
Trp |
Tyr |
|---|---|---|---|---|---|---|---|---|---|
1.754 ± 0.024 | 2.293 ± 0.032 |
4.657 ± 0.03 | 2.977 ± 0.03 |
6.347 ± 0.051 | 5.479 ± 0.038 |
6.711 ± 0.047 | 8.804 ± 0.05 |
1.114 ± 0.02 | 2.614 ± 0.027 |
Most of the basic statistics you can see at this page can be downloaded from this CSV file
Proteome-pI is available under Creative Commons Attribution-NoDerivs license, for more details see here
| Reference: Kozlowski LP. Proteome-pI 2.0: Proteome Isoelectric Point Database Update. Nucleic Acids Res. 2021, doi: 10.1093/nar/gkab944 | Contact: Lukasz P. Kozlowski |
